
Tidal Dynamics Provide Insight into the Impacts of Sea Level Rise
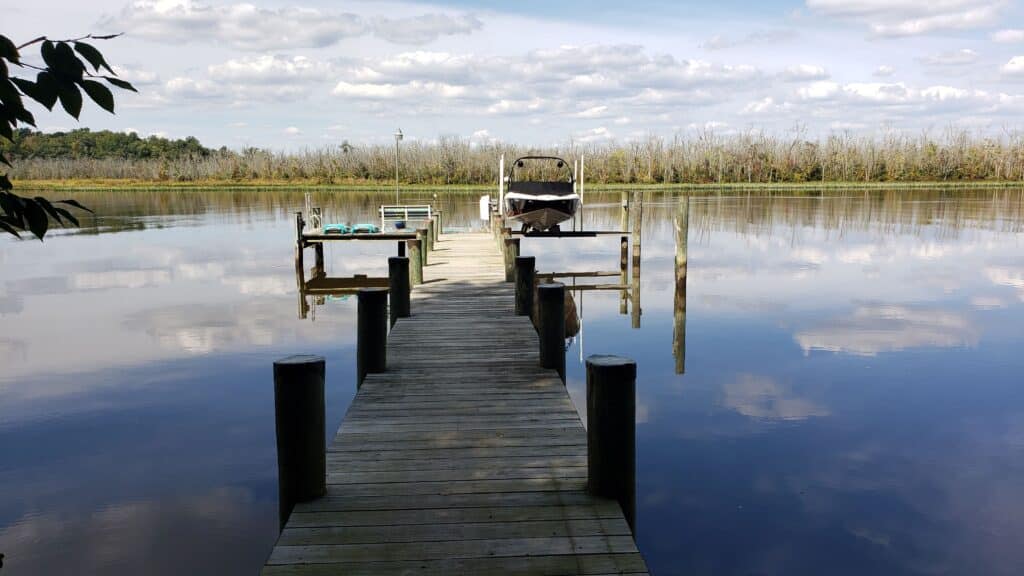
Sea level is not only climbing our coastline and sculpting our salt marshes, it is also pushing ocean tides far inland where they sweep up rivers and roll across their fringing forests. Treasured for their biodiversity, beauty, and other services they provide society, these tidal rivers and their tidal wetlands will evolve from forest to marsh to open water as sea level rises.
The pace of this transition over the coming decades isn’t yet known, but it is likely that even small changes in the interaction between coastal landscapes and their rivers will lead to very different impacts affecting public lands, private property, and environmental management of watersheds and estuaries. Measurements of tides, salinity, and turbidity (waterborne sediment) help provide insight into where and how these impacts are happening.
Stroud Water Research Center investigated these tidal dynamics and associated sediment movement in the Choptank and Pocomoke Rivers (Maryland, USA) using EnviroDIY Monitoring Stations (data are available from the open-access Ensign and Kan, 2024). We developed a reliable and low-cost method for deploying sensors from docks that overcame two challenges.
A Pivoting Arm for Sensor Deployment
The sensors needed to be frequently removed from the water for cleaning and inspection, and replaced at exactly the same water depth to maintain consistent water level measurements. A pivot point was used to swing the sensors into and out of the water, meeting both of these requirements.
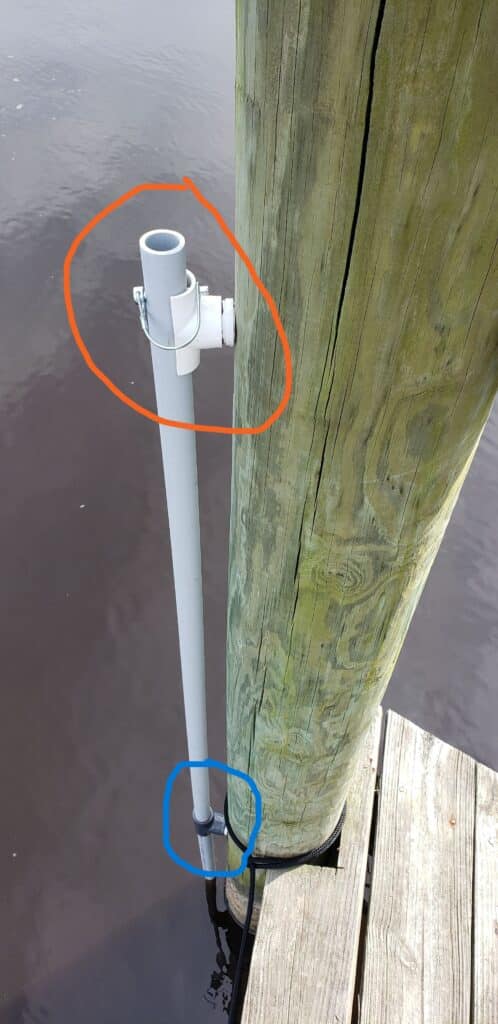
Each mounting location required different lengths of 1” PVC nonmetallic conduit and different orientations of the pivot point and anchor. The photos below show the pipes before the sensor wires were attached.
On the left, the dark gray schedule 80 PVC tee (circled in blue) is located at the top of the length of pipe and is the pivot point; a custom-cut tee with a removable pin near the water (circled in orange) allows the sensor to be rotated out of the water. The custom-cut tee (circled in orange) is a standard PVC tee fitting with one side cut off.
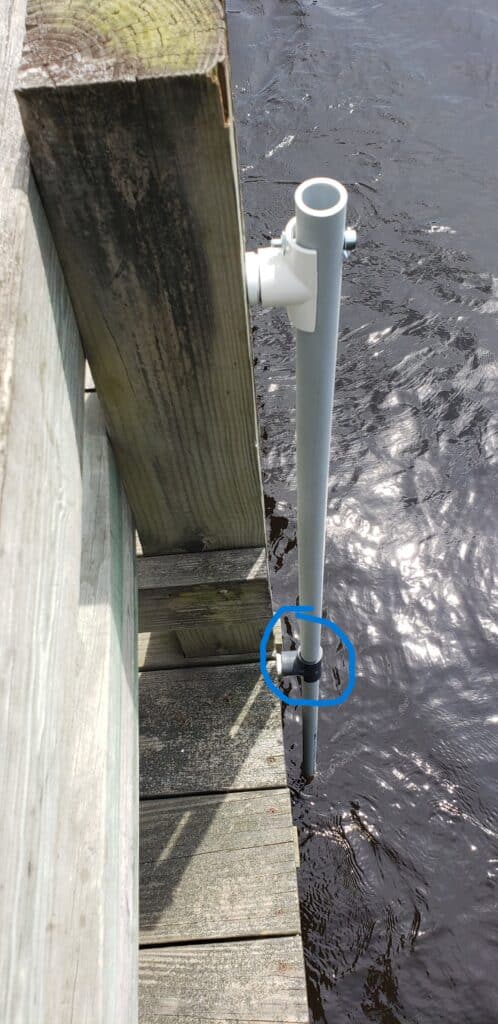
On the right, the pivot point (circled in blue) is in the middle of the overall pipe length, and the removable pin (circled in orange) is at the top. The removable pin secures the pipe in the down position.

This system enables easy access to the sensors for routine cleaning, while also ensuring that the pressure sensor is returned to its original position in the water column for consistent depth measurements.
Connection with an EnviroDIY Monitoring Station
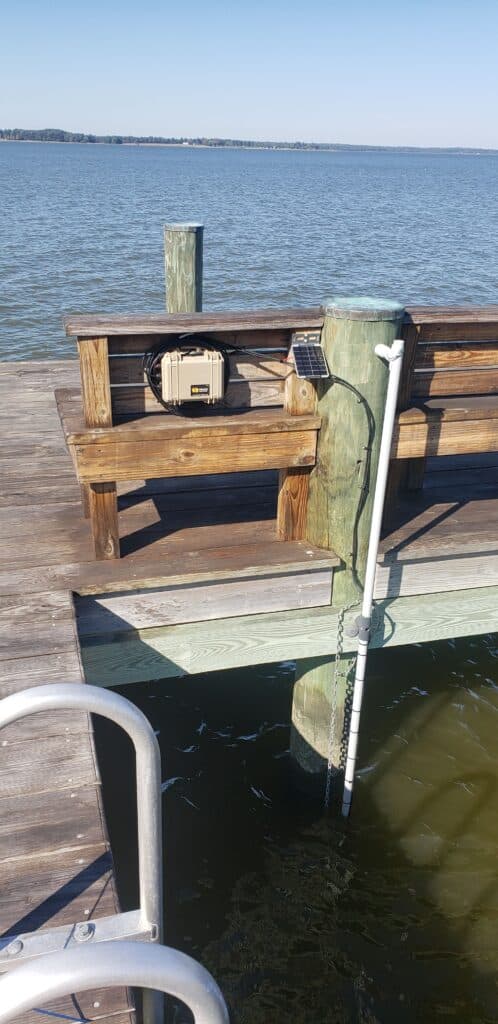
The sensor mounting pipes were located on the sides of docks or piers in areas that were relatively shielded from damage or interference from boats or people. The length of the pipe was carefully calculated to ensure that the sensors would remain underwater during the full range of tide levels. Each PVC tee (circled in blue) was secured to the post with stainless steel lag screws.

The data logger and battery were mounted inside a Pelican 1120 waterproof case that was screwed to a nearby post or underneath a bench on a pier (as shown below). The case is secured with a small padlock. A small 2-watt solar panel was mounted next to each enclosure to charge the 3.7V lithium battery that powers the data logger.


The data logger used with all of these stations was an EnviroDIY Mayfly Data Logger. Each board had an RS-485 Modbus adapter board for communication with the Y-511A turbidity sensor. Those sensors have a motorized wiper that rotates before each measurement to remove any fouling or contaminants from the sensor’s measurement window. The conductivity, temperature, and depth (CTD) sensor utilizes the SDI-12 protocol and can be connected directly to the logger, eliminating the need for additional signal translation. The data loggers also have an LTE cellular module for transmitting data to the Monitor My Watershed Data Sharing Portal.
Pivoting Deployment Arm Helps Keep Sensors Clean
Frequent maintenance visits to the sites were necessary to ensure the sensors were clean and collecting accurate data. The rubber portion of the wiper on one turbidity sensor was occasionally damaged at one station where the water was shallow and there was a large population of turtles, so it was assumed they were chewing on the wiper. The sensor manufacturer provides replaceable wiper tips, so these were installed at certain locations somewhat frequently. Other stations, located further downstream, where the water was more brackish, would easily become covered by barnacles and aquatic plant life if they were not scrubbed regularly.


Some of the logger enclosures were submerged in water during flood events, but due to their waterproof cases, they continued to function properly. A few sensors had to be replaced due to malfunctions or damage.
Overall, they performed reliably during the deployment period and provided continuous data that was recorded to the onboard memory storage as well as transmitted to Monitor My Watershed.
All of the datalogging equipment used to build this station is available from the EnviroDIY Shop. The main piece is the Monitoring Station Kit, plus one RS-485 Grove adapter. The sensors are a Meter Hydros 21 CTD and a Yosemitech Y-511A turbidity sensor.
Acknowledgements
This project was funded by the National Science Foundation Division of Earth Sciences grant 2049073. Matt Pluta and staff at ShoreRivers provided maintenance and monitoring support for monitoring stations on the Choptank River. Billy Weiland, Gabby Ross, and Brenda Davis from the Assateague Coastal Trust provided maintenance and monitoring support for the monitoring stations on the Pocomoke River.

Scott Ensign
In addition to the sensor data published from this project (https://doi.org/10.6073/pasta/54fecf9652c2e4d93e92d64388e6c3eb),
the results of the particle source tracking are published here:
https://stroudcenter.org/publications/interception-river-sediment-estuaries-revealed-by-microbial-community-source-tracking/