
The United States Geological Survey is the primary federal agency responsible for monitoring water resources in the U.S. in partnership with over 1,885 agencies and organizations. This network of over 8,500 streamgages is meticulously maintained to provide high-quality data that informs water availability, water quality, and water predictions. The methods used to collect and manage this data have been developed and honed over many decades by USGS researchers, so their streamgage data is considered a gold standard for environmental data.
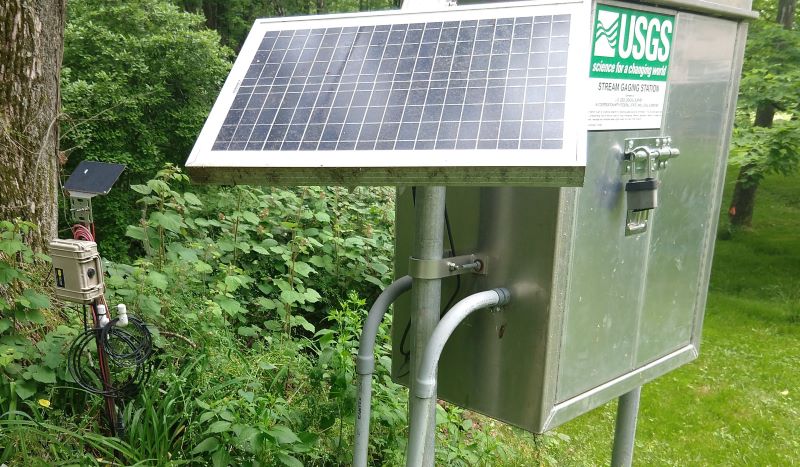
With hundreds of EnviroDIY™ monitoring stations now operating across the U.S. in streams and rivers, we are often asked how they compare with USGS streamgages. They are similar in that both run on solar power and transmit data wirelessly (most EnviroDIY monitoring stations rely on cellular service, and some use short- and long-range radios), but they differ in the types of water sensors they use.
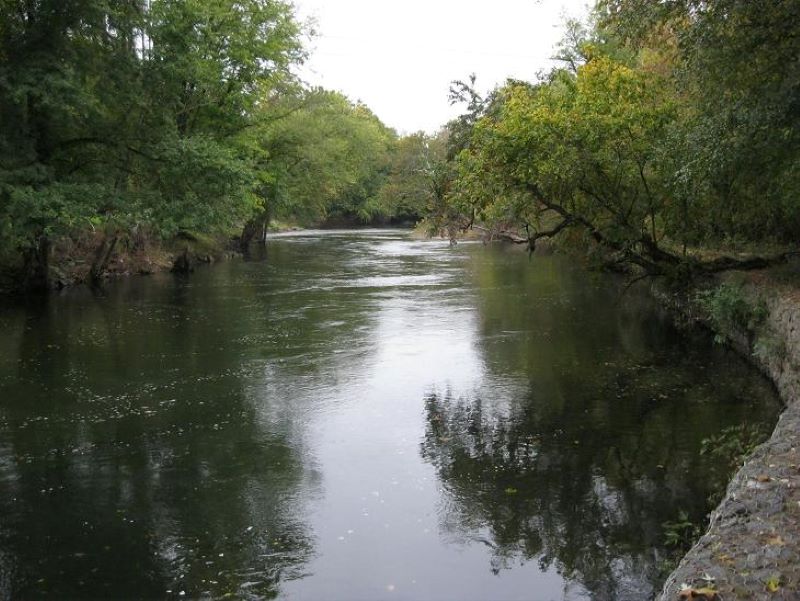
There are many ways to compare sensor accuracy, precision, and response under controlled conditions, but we focus here on comparing data from field deployments over several years under a wide range of conditions. We chose two sites in Chester County, Pennsylvania, where USGS and EnviroDIY equipment are co-located: the Brandywine River at Chadds Ford and the east branch of White Clay Creek near Avondale. The Brandywine River datasets allow a multi-year comparison of sensor coherence, and the White Clay Creek datasets include an additional sensor, turbidity, and evaluation of quality control practices.
Stroud™ Water Research Center first deployed a Meter Group CTD sensor on the Brandywine River in 2017 in a configuration typical of the EnviroDIY monitoring stations; the CTD sensor was used with its factory calibrations. Data for this analysis were downloaded from this site’s page on Monitor My Watershed™; all data on this data-sharing portal are provisional (raw) and have not been subjected to quality control procedures. Therefore, a very cursory amount of quality control was performed by removing temperature, conductivity, and depth values less than or equal to zero, which sometimes correspond with fouling, interference by ice, and accidental removal of the sensor from the water. Conductivity data were not available in the EnviroDIY dataset consistently until 2021.
Table 1. Meter Group CTD sensor accuracy
| temperature | specific conductivity | depth |
|---|---|---|
| +/- 1 oC | +/- 100 uS cm-1 (or 10%) | +/- 25 mm at 20 oC |
Temperature, conductivity, and gage height data from the USGS streamgage were acquired for 2017-2021 using the dataRetrieval package for R. USGS gage height measurements were compared with EnviroDIY monitoring station depth measurements by normalizing each by their annual averages prior to statistical calculation. Measurements by USGS and EnviroDIY were matched on a 15-minute basis and a pairwise comparison of data was performed. Data and R scripts used in this analysis are available on HydroShare.
Table 2. Comparison between EnviroDIY and USGS data for Brandywine River at Chadds Ford downstream of Route 1 (USGS Site 01481000, and Monitor My Watershed site at BRMuseum)
| parameter | year | sample size | mean difference of paired samples | standard deviation of mean difference |
|---|---|---|---|---|
| temperature (C) | 2017 | 13,799 | -0.26 | 0.11 |
| temperature (C) | 2018 | 30,084 | -0.25 | 0.10 |
| temperature (C) | 2019 | 33,629 | -0.33 | 0.11 |
| temperature (C) | 2020 | 33,015 | -0.38 | 0.13 |
| temperature (C) | 2021 | 33,450 | -0.38 | 0.16 |
| depth (m) | 2017 | 13,792 | -0.0003 | 0.0075 |
| depth (m) | 2018 | 28,911 | -0.0046 | 0.0196 |
| depth (m) | 2019 | 33,224 | -0.0009 | 0.1330 |
| depth (m) | 2020 | 33,051 | -0.0003 | 0.1482 |
| depth (m) | 2021 | 33,219 | 0.0009 | 0.2007 |
| specific conductivity (uS cm-1) | 2021 | 33,451 | 7.3 | 14 |
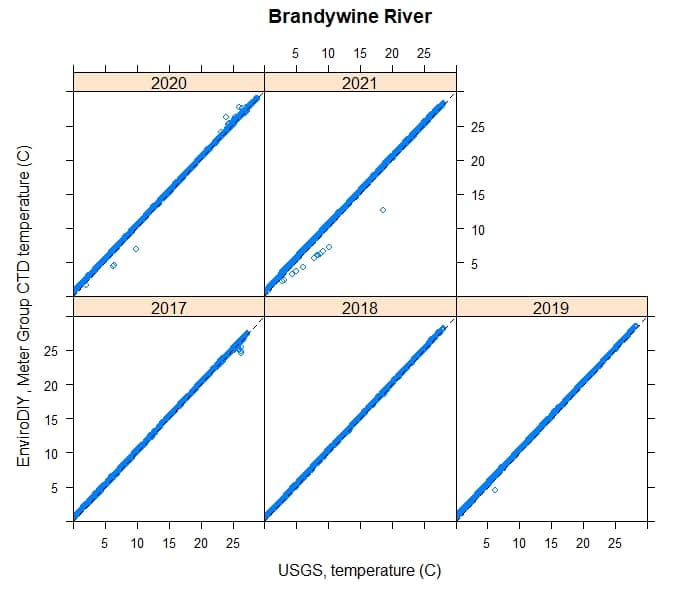
The results show that the EnviroDIY monitoring station measurements on the Brandywine River were, on average, up to 0.38°C cooler than the USGS sensor (Table 2). The very low standard deviation of this mean (Table 2) is reflected in a graphically-uniform 1:1 relationship between paired measurements (Figure 1). This difference in temperature and its standard deviation increased over the five years of comparison.
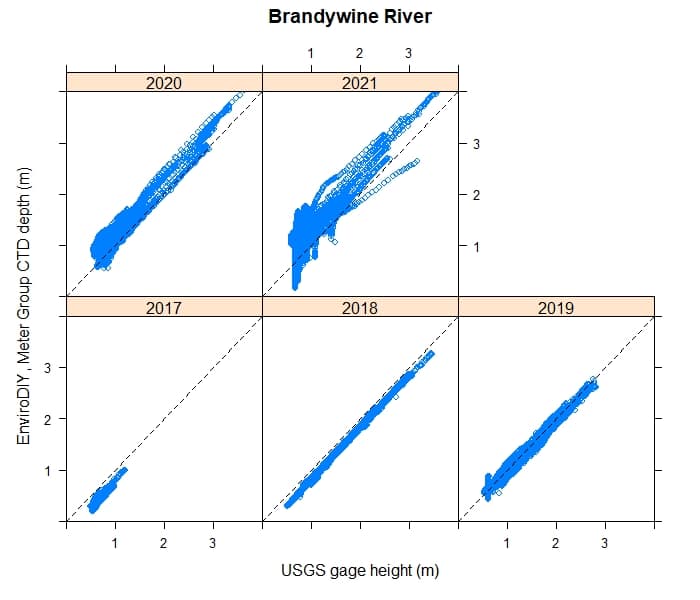
The mean difference in depth between the two datasets was up to 5 mm, and the standard deviation of this difference increased over the five year period (Table 2). The hysteresis of individual events was captured differently in the two datasets, however, and this disparity increased between 2017 and 2021 (Figure 2).
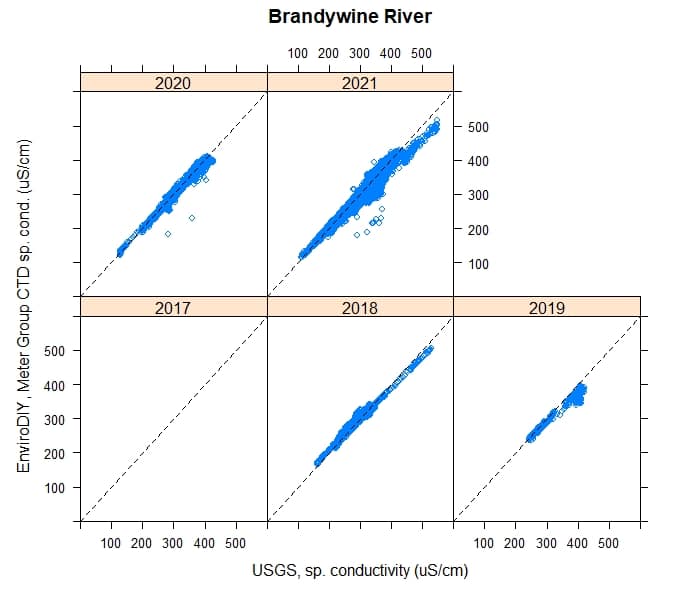
Specific conductivity of the EnviroDIY monitoring station averaged 7 (standard deviation 14) uS cm-1 higher than the USGS station (Table 2). Fewer data were available for comparison during 2017–2020 and were therefore excluded from statistical comparison, but graphical comparison of the specific conductivity data suggests that coherence of the datasets diverged over time (Figure 3).
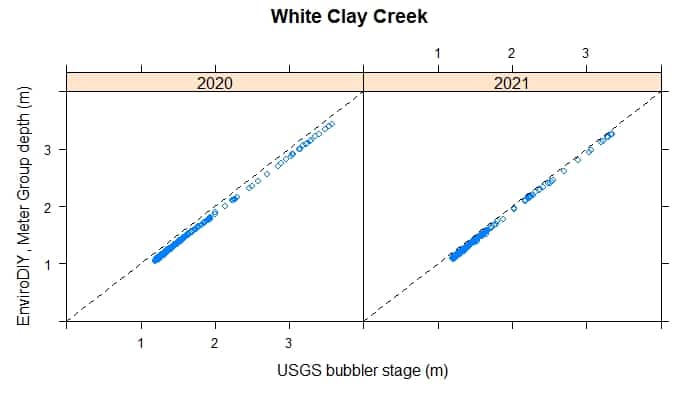
White Clay Creek near Avondale, Pennsylvania, at Spencer Road is much smaller than the Brandywine River below Route 1. In addition to the Meter Group CTD sensor, the EnviroDIY Monitoring Station also includes a Campbell OBS3+ Turbidity Sensor. Both sensors were used with their factory calibrations. On 03 June 2022 at 9:25 EDT, the EnviroDIY Meter Group CTD sensor depth was 0.175 meters and the USGS stage was 3.97 feet (1.210 meters). Therefore, 1.035 meters were added to all Meter Group CTD depth measurements to adjust them to be comparable with USGS stage.
The provisional (raw) EnviroDIY monitoring station data were given two types of quality control. As with the Brandywine River data, temperature, depth, and conductivity values equal to or less than zero were removed as a cursory attempt at quality control. More rigorous quality control was given with the following procedures. First, portions of data in which the sensor was observed to be buried or obviously fouled were deleted because this causes erroneously high or out-of-range values. Second, single point outliers were manually removed based on professional judgment of plotted data. Finally, drift corrections were applied to bring values during periods of light fouling in line with those immediately after a known sensor cleaning.
Annual mean differences and standard deviations were calculated on paired (USGS versus EnviroDIY) samples twice, first using USGS data versus EnviroDIY data with cursory quality control, second using USGS data versus EnviroDIY data with rigorous quality control. Data and R scripts used in this analysis are available on HydroShare.
Table 3. Comparison of USGS and EnviroDIY measurements on the east branch of White Clay Creek near Avondale, Pennsylvania, upstream of Spencer Road (USGS Site 01478100 and Monitor My Watershed site at WCC019)
| parameter | year | sample size | mean difference of paired samples | standard deviation of mean difference |
|---|---|---|---|---|
| temperature (C) cursory QC | 2020 | 25,650 | -0.02 | 0.12 |
| temperature (C) rigorous QC | 2020 | 25,650 | -0.02 | 0.01 |
| temperature (C) cursory QC | 2021 | 25,883 | -0.05 | 0.09 |
| temperature (C) rigorous QC | 2021 | 25,641 | -0.05 | 0.01 |
| depth (m) cursory QC | 2020 | 25,661 | 0.044 | 0.011 |
| depth (m) rigorous QC | 2020 | 25,664 | 0.145 | 0.011 |
| depth (m) cursory QC | 2021 | 25,867 | -0.004 | 0.012 |
| depth (m) rigorous QC | 2021 | 25,884 | 0.105 | 0.041 |
| specific conductivity (uS cm-1) cursory QC | 2020 | 25,648 | -10 | 10 |
| specific conductivity (uS cm-1) rigorous QC | 2020 | 25,632 | -10 | 10 |
| specific conductivity (uS cm-1) cursory QC | 2021 | 25,886 | 7 | 10 |
| specific conductivity (uS cm-1) rigorous QC | 2021 | 24,800 | 7 | 10 |
| turbidity (NTU) no QC | 2020 | 10,367 | -5 | 34 |
| turbidity (NTU) rigorous QC | 2020 | 9,508 | -1 | 19 |
| turbidity (NTU) no QC | 2021 | 24,574 | -86 | 786 |
| turbidity (NTU) rigorous QC | 2021 | 14,257 | 1 | 16 |
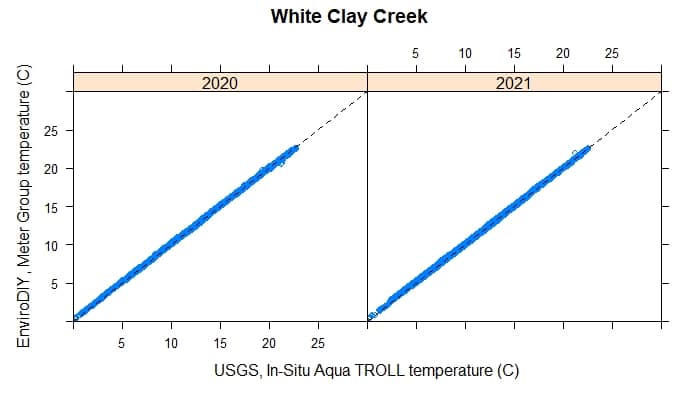
Temperature between the USGS (In-Situ sensor) and the EnviroDIY (Meter Group CTD sensor) differed by up 0.05°C. The mean difference did not change with the level of quality control, but the standard deviation decreased when more rigorous quality control was performed (Table 3). There were no spurious values evident in a graphical comparison of the data (Figure 4).
The mean difference in depth measurements was up to 0.145 m, and the more rigorous quality control effort resulted in a higher mean difference.
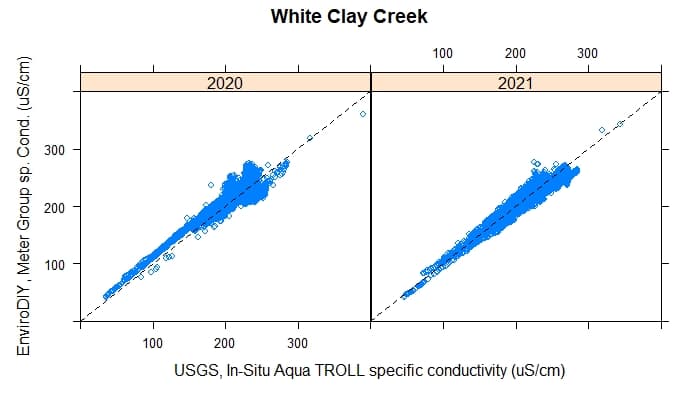
Mean differences in specific conductivity or its standard deviation were not affected by the level of quality control (Table 3). The mean difference between the USGS (In-Situ Aqua TROLL sensor) and EnviroDIY (Meter Group CTD sensor) ranged from -10 uS cm-1 to 7 uS cm-1 (standard deviation of 10). Graphic comparison of paired data reveal some departures from the 1:1 line (Figure 6).
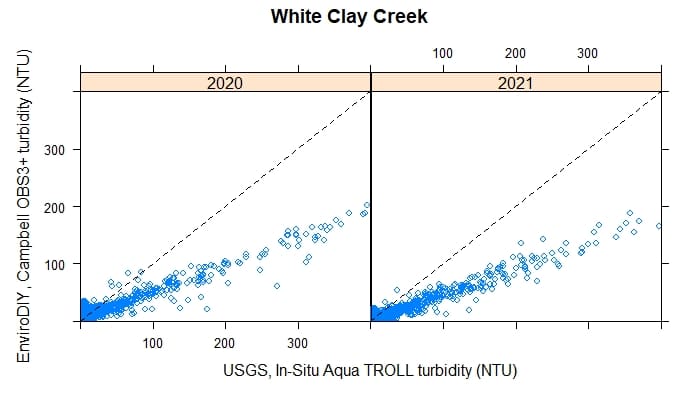
The raw EnviroDIY (Campbell Scientific OBS3+ sensor) turbidity data were much higher than the USGS (In-Situ Aqua TROLL sensor) data, but quality control efforts brought the mean differences to 1 NTU and the standard deviation to within 16 NTU (Table 3). Graphical comparison of the paired data suggests a relationship below the 1:1 line, in which turbidity measured by the In-Situ Aqua TROLL is roughly twice as high as the Campbell Scientific OBS3+ (Figure 7).
Conclusions
This study compared two sensors used in many EnviroDIY monitoring stations (Meter Group CTD and Campbell Scientific OBS3+) with sensors used by USGS streamgages (in White Clay Creek, this was an In-Situ Aqua TROLL sonde). Instead of a purely technical or laboratory comparison of the accuracy, precision, repeatability, and response time of individual sensors, we explored the comparability of measurement results in field deployments lasting between two and five years. Our comparisons inherently included the technical differences between the sensors, but also included the effects of differences in placement in the water column and lateral cross-section, fouling, maintenance, and degradation of sensor performance.
For temperature, we found a larger difference between sensors on the Brandywine River than on White Clay Creek. In all cases, the mean difference + standard deviation is less than 1°C, the accuracy of the Meter Group CTD sensor. Given the larger size of the Brandywine, the larger difference on the Brandywine could reflect cross-channel differences in temperature or differences due to vertical placement in the water column. The Brandywine River data suggest that coherence between temperature sensors degrades, but it is unknown whether this was due to performance loss from the Meter Group CTD sensor or the sensor used by USGS. With a cursory amount of quality control (removing zero and less-than-zero data), we regard the Meter Group CTD temperature data to be comparable with USGS data.
For water depth, we found differences of up to 44 mm between USGS and EnviroDIY measurements. More rigorous quality control did not necessarily improve the correspondence between sensors. We regard the Meter Group CTD depth data subjected to cursory quality control procedures to be comparable with USGS data, but we note that the increase in standard deviation over time indicates degradation in the sensor’s response and accuracy.
Specific conductivity results at both sites were similar: the Meter Group CTD sensor averaged 7 uS cm-1 (standard deviation of 10 uS cm-1) higher than the USGS measurements. Rigorous quality control of the Meter Group CTD data did not improve correspondence between sensors. We regard the Meter Group CTD sensor data to be comparable to the USGS data.
Comparison of turbidity data is complicated by differences in methodology: the In-Situ Aqua Troll measures reflectance at a 90-degree angle (consistent with ISO 7027), whereas the Campbell Scientific OBS3+ turbidity sensor measures reflectance between 90- and 165-degree angles. Both technologies are equally capable of being used for particulate matter characterization (Boss et al. 2009), but they may not provide identical responses if they are exposed to dissimilar hydrodynamic conditions that suspend a mixture of sediment types (as is the case in White Clay Creek). The standard deviation of paired samples (16 NTU) may be in part due to these factors. The mean difference between paired samples was only 1 NTU, reflecting the dominance of baseflow periods when turbidity was low. Turbidity increased during storm events, but the In-Situ Aqua TROLL sensor reported values 2- to 3-fold higher than the Campbell Scientific OBS3+ sensor. We expect this consistent difference is due to different calibration of the sensors (the Campbell Scientific OBS3+ sensor was used with factory calibration) and that these differences would be reduced if both sensors were more carefully calibrated to the same standards.
We conclude that a properly maintained EnviroDIY monitoring station that employs a Meter Group CTD sensor (temperature, depth, and conductivity data) closely matches USGS data if a cursory quality control procedure is followed. Data from EnviroDIY monitoring stations that employ Campbell Scientific OBS3+ sensors must be given more rigorous quality control but even then can routinely differ from USGS turbidity measurements by 16 NTU and more during storm events.
BrianJastram
Scott, your study is a riveting read and very well done. I find your conclusions encouraging to the work I have been doing and to the field of EnviroDIY. Your analysis provides the answers to questions that we all wanted to know.
Scott Ensign
Thanks for the feedback, Brian!
James_NZ
Hi Scott, interesting article! Regarding turbidity, Rob Davies-Colley, an academic here in NZ has been doing some research comparing nephelometers, as turbidity thresholds are often written into environmental consent documents for discharges into freshwater bodies. His findings are similar to what you found, i.e., there can be up to two-fold difference in magnitude between sensors, even for sensors with identical ISO standards. I have also heard Rob speak at conferences and he has stated that even two identical turbidity sensors from the same manufacturer can have very different NTU/FNU responses. However there will generally be an overall relationship between sensors.
In short, this means that turbidity can’t be reliably compared between sensors (or across sites) in it’s raw form. However, you can develop a relationship between the sensor output and an SI unit measurement (i.e., Total Suspended Solids) and then compare that.
https://doi-org.ezproxy.waikato.ac.nz/10.1002/hyp.14399
Scott Ensign
Hi James; thank you for providing this input and emphasizing the challenges of using turbidity as an absolute measure of a physical property. This issue has been explored and reported on in the past, but Rob Davies-Colley’s recent publication provides a very valuable analysis (note that the link you provided is internal to Waikato, so others might want to go here instead: https://onlinelibrary.wiley.com/doi/abs/10.1002/hyp.14399).