
Most of the water monitoring technology discussed on EnviroDIY focuses on physico-chemical parameters like temperature, salinity, turbidity, and oxygen. An alternative is to monitor animal behavior and physiology as biosentinels of pollution.
Shellfish Gape as a Pollution Indicator
Luke Miller, Ph.D., (EnviroDIY user @millerlp) and his team at San Diego State University monitored the shell opening (gape) of oysters and mussels in the Tijuana River Estuary and Los Penasquitos Lagoon. When the polluted, oxygen-deprived water from upstream areas flows into the estuary, the shellfish protect themselves by closing their shells (check out a video of the action, below).
The researchers evaluated the severity of the pollution by relating how long the shellfish kept their shells closed relative to the tidal patterns in salinity and oxygen. Some of the monitored shellfish died during these periods because they couldn’t feed and respire normally with their shells closed.
Shellfish gape was monitored in real-time using Monitor My Watershed (see this example on the Tijuana River Estuary).
An Open Source Approach to Monitoring
There aren’t off-the-shelf systems for measuring shellfish gape, so Miller developed his own open source approach, as he explains in the journal Integrative and Comparative Biology. His earlier MusselTracker datalogger project evolved into the Habitat Heartbeats project with an open source collection of hardware and software.
Miller’s Mayfly Adapter GitHub repository details how the Mayfly Data Logger can serve as the backbone for the system.
Photos and captions by Luke Miller
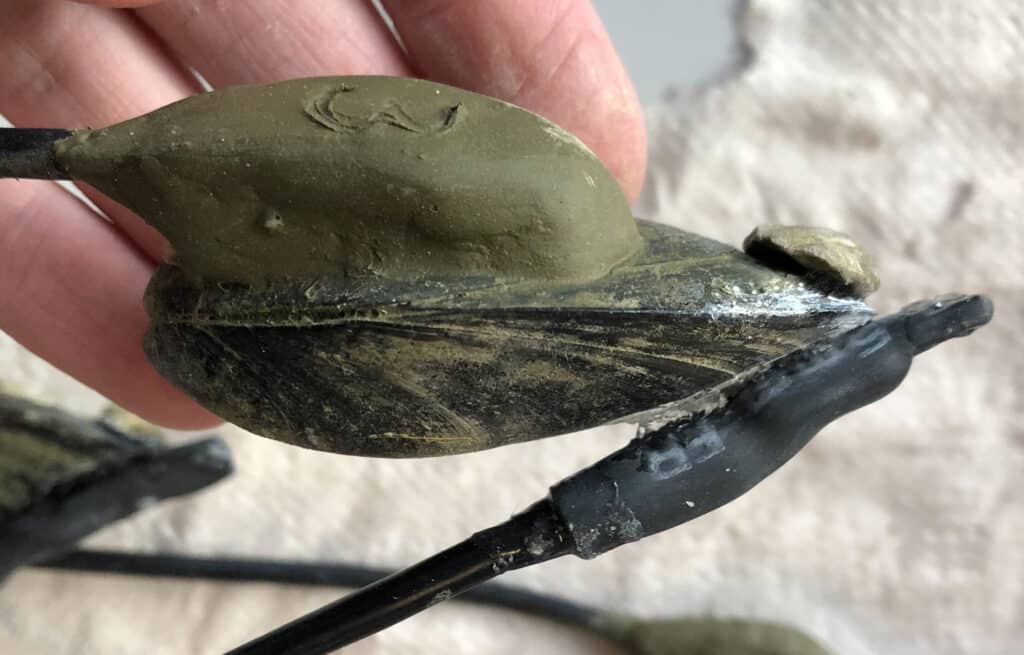
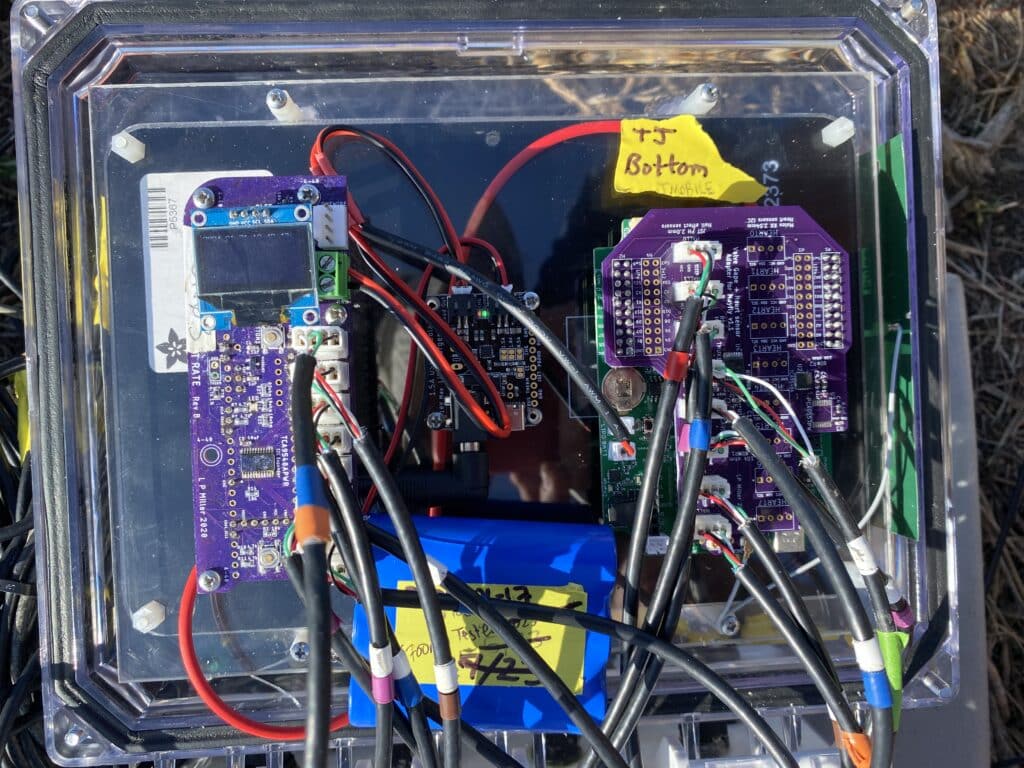
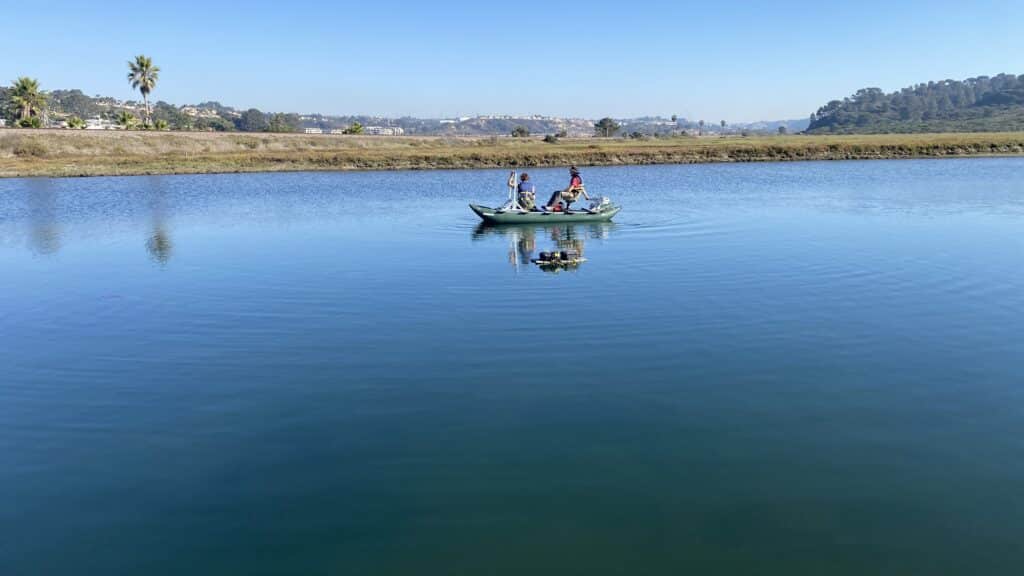
Photo 1: This mussel (Mytilus galloprovincialis) has two biosensors attached. An infrared heart sensor covered in epoxy is on one half of the shell, and a Hall effect magnetic sensor is attached to the other half, opposite a small magnet. The Hall effect sensor signal detects when the shell opens and closes, records data to the Mayfly Data Logger, which transmits to Monitor My Watershed.
Photo 2: Oyster and mussel biosensors are recorded on a Mayfly Data Logger (right, for shell opening data) and a Teensy 3.5 data logger (left, for heart data). In the center is an Adafruit solar panel battery charge controller hooked to an Adafruit 6600mAh rechargeable lithium-ion battery pack.
Photo 3: The team deploys groups of instrumented oysters and mussels on floating moorings in San Diego estuaries, including Los Penasquitos Lagoon, pictured here. Solar panels power the data loggers, and the Mayfly Data Logger with Xbee3 LTE-M cellular modem can reach local cell towers around this urban estuary. Water quality sensors, including a CTD and dissolved oxygen sensor, are mounted to the mooring line as well.