
Data producers willing to share their data are the foundation of the Internet of Water, but first and foremost, that data must serve the needs of the data producer.
Consider Ed McCoy’s challenge. As a fly fishing guide in Michigan, he has to make decisions every day on where to take clients based on the water level along the river, but visiting those sites takes time that could better be spent fishing. The solution was real-time monitoring equipment to relay water level to the Monitor My Watershed Data Sharing Portal, allowing Ed to save time and make informed decisions.
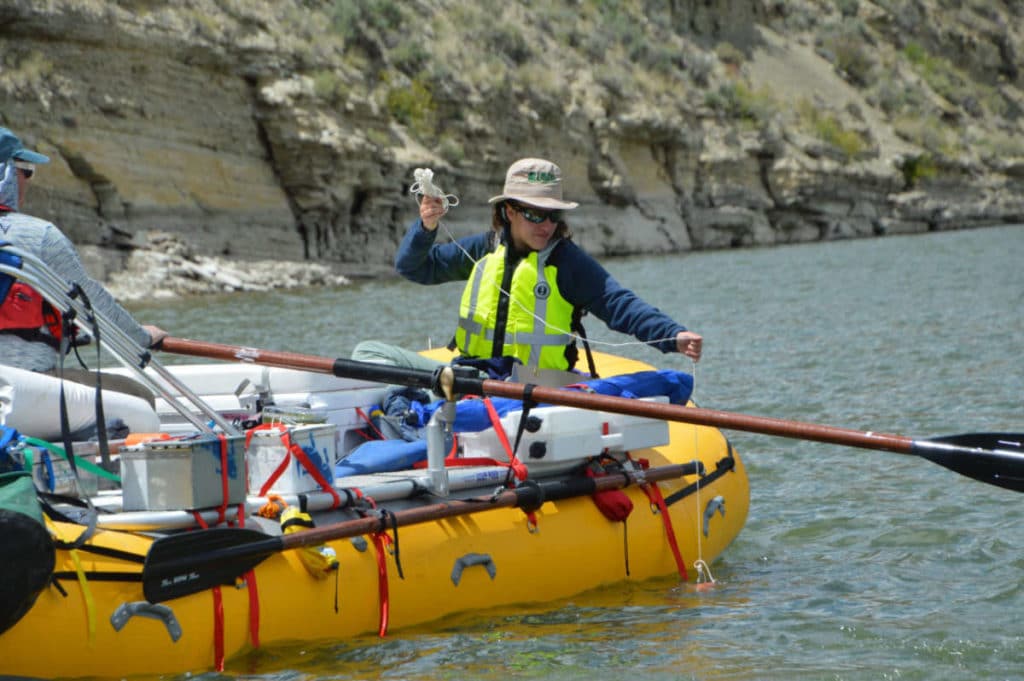
Or take researcher Adam Gold’s challenge of timing his stormwater sampling in North Carolina around runoff events that are sudden and hard to predict. The real-time, wireless surveillance of water levels provided by Monitor My Watershed helped him determine when to collect samples.
What is Monitor My Watershed?
Monitor My Watershed is a water quality data sharing portal that enables users to continuously stream real-time in-situ sensor data and visualize that data through a web application. This free and open-source platform has powerful advantages for researchers, students, community scientists, and more.
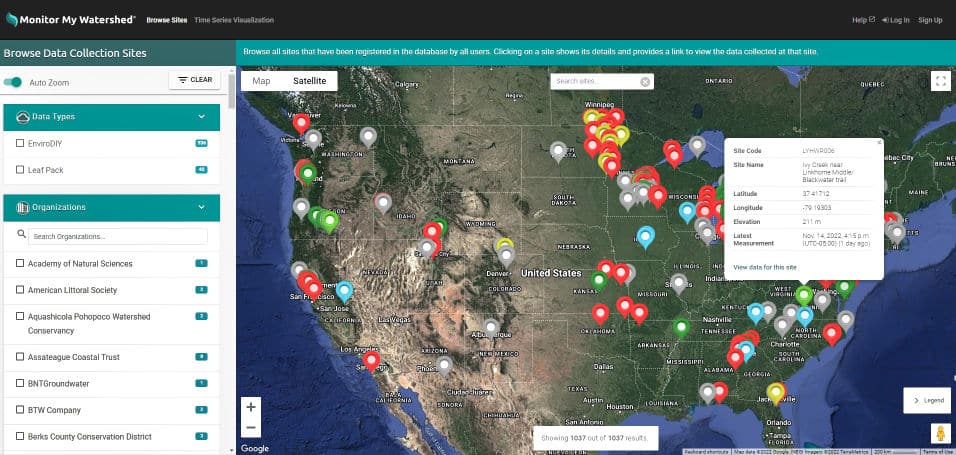
The Monitor My Watershed Data Sharing Portal provides data sharing and management services to over 150 people from over 100 organizations around the world and the data they contribute serve the greater good via the Internet of Water.
These users found their way to Monitor My Watershed through instruction from Stroud Water Research Center(the host of Monitor My Watershed), and interaction with LimnoTech (the technical developer of Monitor My Watershed), the Consortium of Universities for the Advancement of Hydrologic Science (CUAHSI) community, and many other applications. Technical documentation is maintained on GitHub and instructional material is provided by the Stroud Center.
While users’ research and monitoring applications are unique, and they may value different aspects of the service, they all share a common appreciation for open data and the value it provides to environmental science and management. To put their hands on their data (or others’ data), most users download a CSV file (either through a graphical click on the web app or by constructing a URL from the site and parameter universally unique identifiers). Data is also cataloged in CUAHSI’s Hydrologic Information System (a hub in the Internet of Water) and made accessible using CUAHSI’s WaterOneFlow API.
The Origins of Monitor My Watershed
Monitor My Watershed originated from the CUAHSI community’s need for a FAIR and hydrologically-relevant earth science data model and the cyberinfrastructure required to scale it up.
The Observations Data Model (ODM) was developed in the mid-2000s to serve the diverse needs of the environmental science communities of CUAHSI, the Critical Zone Observatories, and other initiatives for storing, managing, and sharing data following the Open Geospatial Consortium standards and with prescient focus on linking unique identifiers of measurements within a hydrologic network (Horsburg et al 2008).
Over the next decade, the growing demand to accommodate ex-situ as well as in-situ measurements from diverse scientific fields, the need to accommodate ever larger datasets including real-time data, and new standards developed by the World Meteorological Organization and the Open Geospatial Consortium inspired the development of ODM2 (Horsburgh et al 2016).
CUAHSI adopted ODM2 for storing time series datasets in its HydroShare service, and Hsu and colleagues (2017) demonstrated its application in four diverse earth science disciplines. In 2019, Horsburgh and colleagues reported the development of an ODM2 web-based data sharing portal and its implementation as Monitor My Watershed Data Sharing Portal to support real-time in-situ data collection by the Delaware River Watershed Initiative.
Measuring Up
How does Monitor My Watershed compare with other database types for environmental Internet of Things (e-IoT) data services?
Monitor My Watershed uses TimescaleDB, an open-source timeseries database that supports standard SQL queries, with a PostgreSQL relational database. PostgreSQL is an open-source object-relational database that uses and extends the SQL language. This combination supports the extensive metadata allowed within ODM2 and preserves performance requirements as cardinality grows with additional sites, parameters, and related results.
In the domain of e-IoT, a more recent alternative to TimescaleDB is InfluxDB. It relies on Flux scripting language which is optimized for time series data queries. CHORDS and Dendra, both developed through the NSF’s EarthCube, use TimescaleDB.
Where Is Monitor My Watershed Going?
ODM2 and its implementation in Monitor My Watershed are still actively being developed; the most recent advancement to the web app was migrating it to Amazon Web Services.
Currently, Monitor My Watershed is only exposing a fraction of the power of ODM2 for managing environmental data. Monitor My Watershed will soon begin accepting observational data, such as bacteria and nutrient concentrations from grab samples and individual sensor measurements useful for quality control.
Alongside these observational records, the new version of Monitor My Watershed will include enhanced metadata management tools for in-situ timeseries and ex-situ observations.
The Time Series Visualization tool for exploring data will also be improved with statistical summaries and plotting functionality. We will also implement new APIs for better interoperability, providing an alternative to the relatively outdated WatersOneFlow API.
Finally, Monitor My Watershed sites have the potential to be documented with Geoconnex for better global indexing in the Internet of Water. An upcoming demonstration of utilizing the USGS Network-Linked Data Index for sites in Monitor My Watershed will also promote the adoption of these important practices within the user community.
This article was originally published by the Internet of Water Coalition.