
By David Bressler, Rachel Johnson, Mike Hartshorne, and Scott Ensign
Quick quiz: How often should you clean the conductivity and turbidity sensors on your EnviroDIY Monitoring Station?
A. Once a year.
B. Once a week.
C. Once a day.
If you answered once a year, you might be wasting your time deploying a monitoring station because your sensors will be too fouled to make useful measurements. If you answered once a day, you might have too much time on your hands. If you answered once a week, YOU ARE CORRECT!
Regular cleaning of your EnviroDIY Monitoring Station sensors is the most important step in making sure you are collecting meaningful data that you, and others, can use for diagnosing water quality.
To emphasize how much a dirty sensor can degrade the quality of your data, we’ll share our experience from a recent trip to perform a quality control check on an EnviroDIY Monitoring Station on the Schuylkill River in Pottstown, Pennsylvania.
Our quality control process is to clean the sensors thoroughly before doing the cross checks (i.e., cross referencing measurements taken with a calibrated handheld meter against the readings from the station). First we scrub the outside of the Meter Hydros 21 CTD sensor (Photo 1) and then clean the screw heads which measure conductivity inside the “slot” of the sensor (Photo 2).
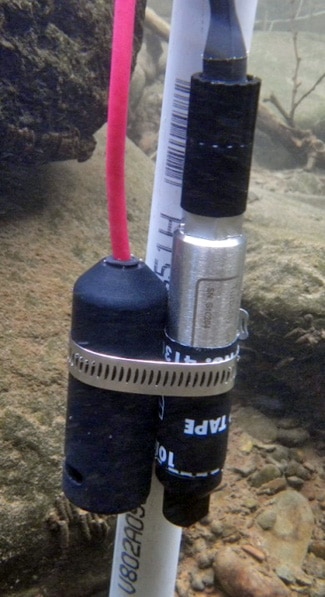
Photo 1. Meter Hydros 21 CTD sensor (outer body) 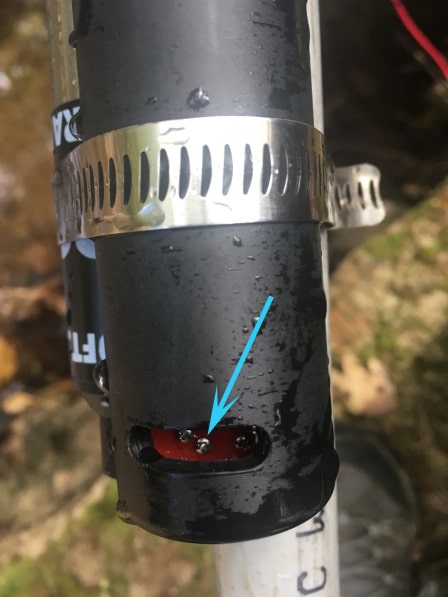
Photo 2. Screw heads where conductivity is measured.
In a few graphs below we will show that:
- Cleaning the outer body of a dirty (e.g., covered in algae and sediment) CTD sensor can dislodge material which gets stuck inside the CTD sensor and degrades readings.
- Therefore, it’s critical to also gently clean the screw heads inside the sensor using the long soft bristles of a dish brush.
- Immediately after cleaning the outside and inside of the sensor the accuracy of the conductivity measurements improved.
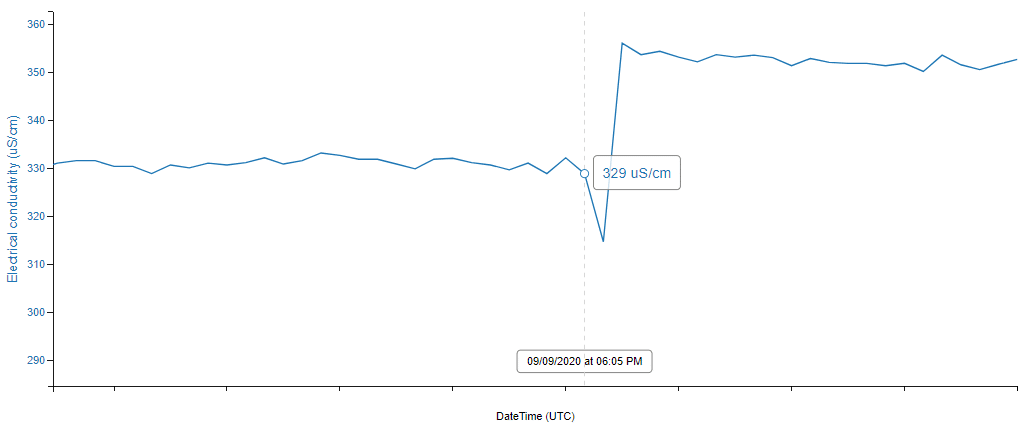
When we arrived at the site conductivity was 329 μS/cm (Figure 1). We photographed the sensors noting that they had accumulated algae and sediment since the last cleaning several weeks ago (Photo 4).
We cleaned the sensor with the white bristles of a dish scrub brush (Photo 3), removing all loose debris from the CTD sensor, as well as from the rest of the sensor bundle.

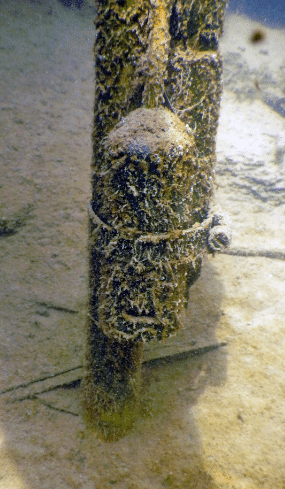
Photo 4. Outer body of CTD sensor before cleaning. 
Photo 5. Outer body of CTD sensor after cleaning.
After cleaning the sensor body, we conducted our quality control cross checks. The calibrated handheld conductivity meter reading was 380 μS/cm, while the monitoring station measured 314.8 μS/cm (Figure 2), lower than what the station was reading prior to our cleaning of the sensor (329 μS/cm) and even further away from the 380 μS/cm of the calibrated handheld meter.
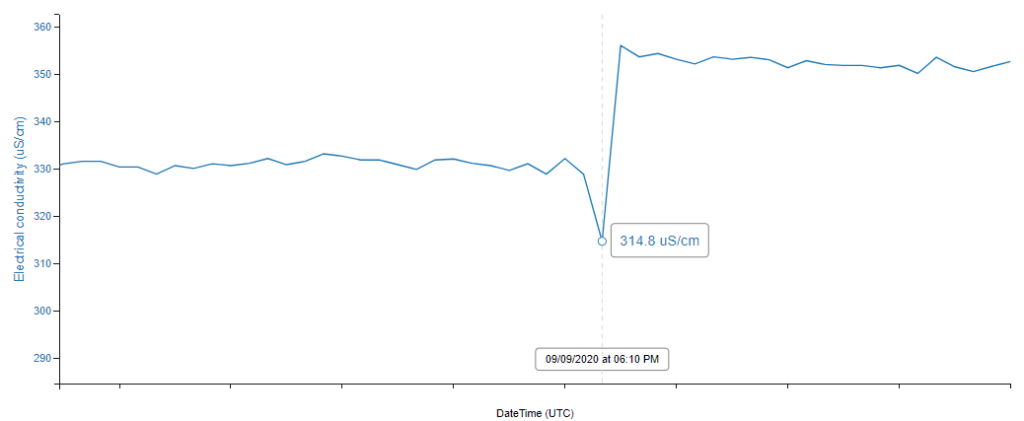
We consider a cross check conductivity difference of up to 30 units to be acceptable, especially in situations like this where conductivity is fairly high; but the difference here of 65 μS/cm indicates there was a problem.
We suspected that the conductivity screw heads were already fouled and that sediment and debris that was dislodged during the cleaning of the CTD sensor body exacerbated the problem.
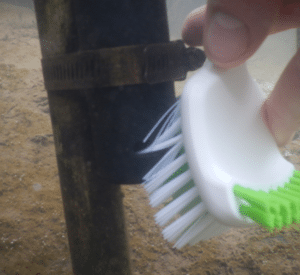
To clean the screw heads inside the CTD sensor, we again used the soft bristles of the brush, inserting them into the CTD slot deep enough to ensure that the bristles were contacting and dislodging debris from the screw heads (Photo 6).
We cleaned the screw heads very gently so we didn’t damage the delicate pressure transducer located just above the screw heads in the CTD slot.
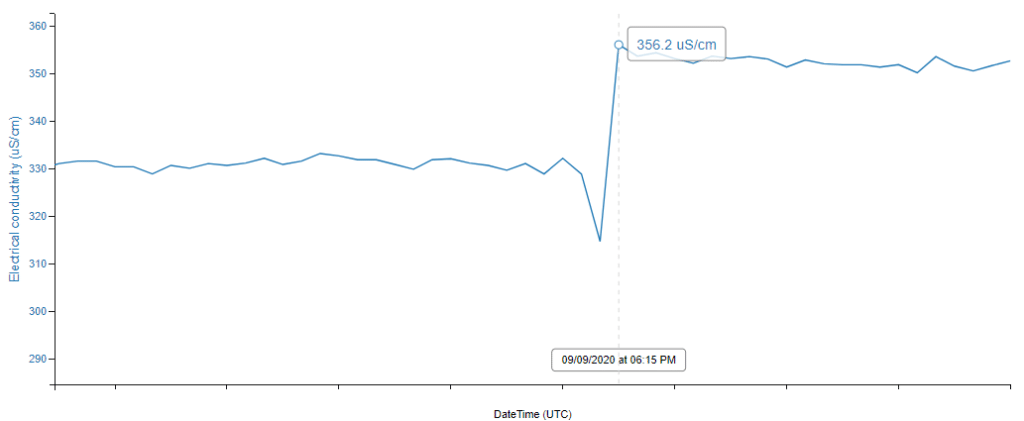
After we cleaned the screw heads, the CTD sensor reading that followed of 356.2 μS/cm (Figure 3) was substantially closer in value to the measurement from the calibrated handheld meter (380 μS/cm) and within our acceptable range of error. If the sensor readings had still not recovered to our acceptable range, our next step would have been to remove the sensor bundle from the stream, inspect the screw heads, and further clean them with a Q-tip.
This case study points out the importance of not only cleaning the CTD sensor, including the conductivity screw heads (especially when algae and sediment accumulation is severe), but of evaluating quality control cross check results on-site and making adjustments.
The screw heads in your own CTD sensor may not need to be cleaned during every visit, particularly if sensors are being cleaned weekly or if there has not been significant accumulation of debris in and on the sensor. However, the only way to know whether further cleaning is needed is by making independent quality control measurements.
Happy water-quality monitoring, and don’t forget to clean your sensors!
Video Resources
Check out the Videos page for videos on how to maintain and enhance an EnviroDIY Monitoring Station and much more!