
By Marion Waggoner and Dave Yake
Background
We (Save Our Water) started a program to monitor the Broad Run stream in late 2014 with the primary objective of establishing a base line of stream flow throughout the year in the event that anticipated commercial pumping of a well located in the aquifer underlying the stream began to affect the stream flow and quality. The Broad Run is a small tributary of the east branch of the White Clay Creek located in the extreme southeastern portion of New Garden Township in Chester County, Pennsylvania. A secondary objective of understanding the sediment load coming into the stream has since been adopted.
Visual stream observations during rain storms show that most of the sediment occurs in about the first mile of the stream headwaters, immediately upstream of the Somerset Lake impoundment/lake (with an earthen dam). The Somerset Lake housing development surrounds the lake and was constructed approximately 35 years ago. In this case, the presence of the lake is good for the downstream stream quality because it allows settling time for heavy sediment. Testing of grab samples from the entrance to the lake vs. those taken after the dam spillway show that approximately 2/3 to 3/4 of the sediment is retained in the lake and does not pass further downstream. The lake was designed with a so-called” fore-bay” that outlets to the lake proper. The designers intended that the fore-bay would act as a settling basin to substantially reduce the sediment going into the lake. As such, the Somerset Lake community is forced to dredge the fore-bay every 3-5 years to remove the excess sediment.
The lake community hopes to persuade the township to help mitigate sediment flow from the Broad Run into the lake. As part of the open space program, the township had already preserved a substantial part of the land upstream of the lake. So, it is possible that there might be public funding of a project or projects upstream of the lake to reduce erosion. However, in order for that concept to gain priority with the township, some background characterization data of sediment load vs. storm runoff is needed. “Save Our Water” wants to assist in this work because a reduction of the sediment load clearly will also benefit the downstream portions of Broad Run.
Low-Cost Sampling Equipment
The team we have formed to work on this problem consists of Marion Waggoner and Dave Yake (Save Our Water) and Bill Ward (Somerset Lake Committee). Bill has set up a small lab in his basement to analyze storm runoff samples for total suspended solids (TSS) as part of an integrated characterization of sediment load during a rain event. A commercial water sampler (such as those built by ISCO) cost well above our available budget. So, a “Do It Yourself” (DIY) approach was necessary.
Recently, we have successfully implemented a setup using a Mayfly Data Logger to monitor stream level with a “Maxbotix” ultrasonic sensor and controlling two separate low-cost, battery-operated pumps to collect two discrete samples of water during stream recession. Details will be presented at a later time.
Siphon Bottle “Tower Sampler”
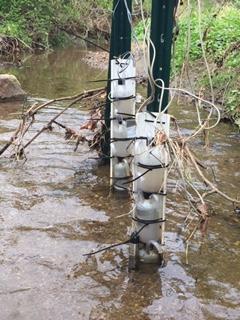
Picture 1: Two DIY tower samplers in a stream.
In late 2019 we set aside the pump sampler and began development of a much lower cost and very simple “Tower Sampler” that utilized plastic bottles mounted vertically in the stream to collect discrete samples as various stream levels (Picture 1).
Initially, we tried bottles which simply collected samples when the water overflowed at the top, but soon adopted a siphon bottle concept. The USGS demonstrated this concept over 70 years ago using heavy glass bottles, however the approach fell out of favor when electronic systems were developed to either control sophisticated pump samplers (such as the ISCO samplers) or in-stream turbidity sensors/loggers (which theoretically could eliminate the need to run TSS on all samples, however the experience of the authors is that turbidity probes foul and signal noise is an issue). Refer to the following reference to see examples of siphon bottle designs: “A Modified Siphon Bottle Sampler for Shallow Water“, Timothy H. Diehl, USGS Scientific Investigation Report 2007-582. Page 7 of the report has a good drawing useful as a design reference when reading the design sections below.
Our trial and error experimentation using plastic bottles has yielded a robust low-cost design that can easily be constructed at home.
Bottles
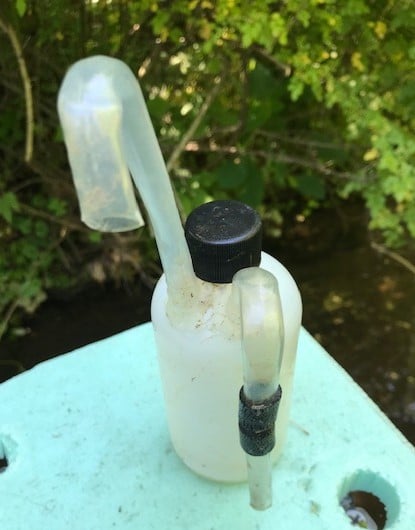
Picture 2: Placement of the siphon and vent tubes on the neck of the bottle.
We found several sources of bottles and selected Berlin Packaging which offers a wide variety of bottles and caps — we use a 1 pt. or 250 cc size. We strongly recommend a polyethylene bottle. The chief reason is that the siphon tube and air vent for a bottle must be cemented/glued into the bottle so that they are fixed in place and the seals are water/air tight without leakage, even after considerable exposure to sunlight and/or water. A hot glue gun does an excellent job and most “glue sticks” are based on polyethylene copolymers that adhere very well to both the bottles and the tubing. Picture 2 shows the placement of the siphon and vent tubes on the neck of the bottle.
NOTE: Mark the locations for the tubing to be inserted in the bottles and drill the holes in bottles with an electric drill (use gloves!!).
Siphon and Vent Tubing
We selected a tubing type used in air/pump systems for aquariums. This tubing is low cost and can be bent at modest temperatures to form the necessary “U shaped” crooks at the tops. We do not know the actual composition, but it is likely acrylic based on clarity and low temperature softening. Furthermore, the hot glue forms a waterproof bond to the tubing and the bottles.
One source of this is Amazon — who stocks tubing sold by Lees Aquarium. Several sources of the Lees Aquarium materials can be located on the internet. The size that worked best overall was the 3/8″ tubing.
NOTE: Once the water level rises to the top crest portion of the sample tube the siphon is triggered and a one-pint bottle would fill in approximately 12-15 seconds.
Bending the Tubing to Form the “U-Shaped” Crooks at the Top
You may have bent glass tubing in a lab course (or at least have seen it being done). This involved heating the tubing all around the circumference with a flame until it softened and then making the bend. That will not work well or at all with plastic tubing. First, a flame generates too much heat in a concentrated area. The plastic will burn/blister, etc. A much more diffuse source of heat is required. A heat gun will work, but most of us do not have access to those. However, the aquarium tubing softens enough in boiling water to allow bending.
NOTE: Use proper safety precautions to do this — that is, wear gloves when handling the hot tubing.
Plastic tubing is very unlike glass tubing to bend. Glass has low elastic memory when softened/melted. Plastic tubing —because of polymer chains orientation — has long elastic memory and resists bending. In addition, except for very low diameters, plastic tubing is easily kinked. However, there is a solution from the internet to allow even a novice to make a suitable, workable (but not necessarily very pretty) bend.
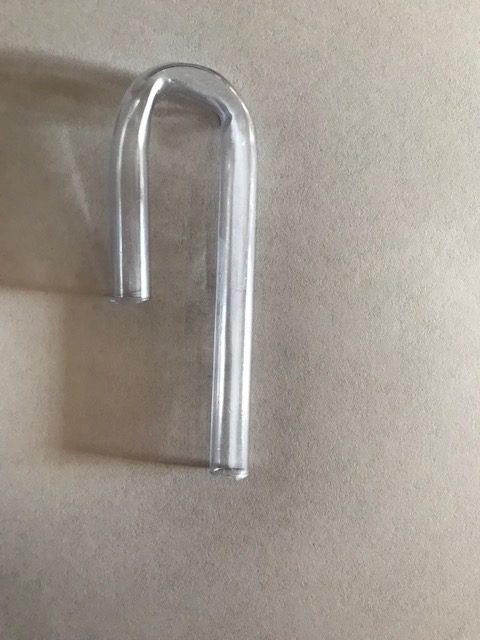
Picture 3: A sample bend in 3/8″ tubing.
The concept is to prevent the tubing from collapsing during the bending process by inserting a “formable core”. The core material is removed after the bend is made. This approach works well with the 3/8″ tubing by first inserting a length of ordinary lamp electrical cord (pre-greased with something like Vaseline) in the tubing with some sticking out of one end of the tubing.
Next, insert the end of the tubing to be bent in a container (tall kettle) of boiling water for maybe 1 minute. Remove the tubing and slowly form the bend (with gloves!!). Do not attempt to do this very quickly or you will form kinks. If the tubing gets too cold, reinsert in the hot water and bend further with each reheating.
After you get a complete U formed, let the tubing cool. Next, take pliers and pull out the greased lamp cord. This may seem challenging; however, it gets much easier with a little experience. Picture 3 shows a sample bend in the 3/8″ tubing made by the above technique.
Critical Design Issues for the Siphons
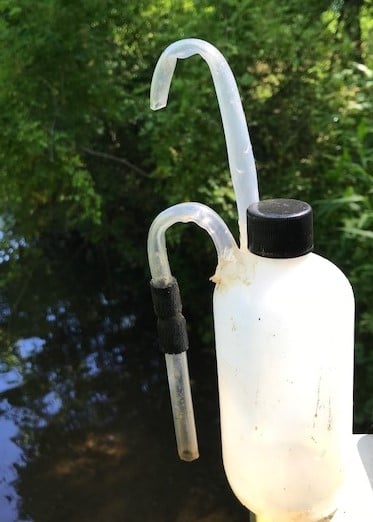
Picture 4: a working siphon bottle
Refer to the USGS paper (page 7) and see Picture 4 as you read the text. The photo was taken from one of our working siphon bottles.
- The “U-crooks” on both the siphon tube and the air vent must point downward.
- The “crook” at the top of the siphon tube sets the trigger point at which the siphon starts. The bottom end of the siphon must be located at or above the bottom end of the air vent tube inside the bottle (not visible in the photo). See drawing in USGS paper.
- The bottom end of the U-crook at the top of the vent tube must be located above the crook in the siphon tube. See photo.
- The bottom end of the vent tube inside the bottle sets the point at which the siphon stops the sample intake. Refer to the drawing in the USGS paper.
- When this is all complete, be sure to put the cap on the bottle.
Mounting the Siphon Bottles
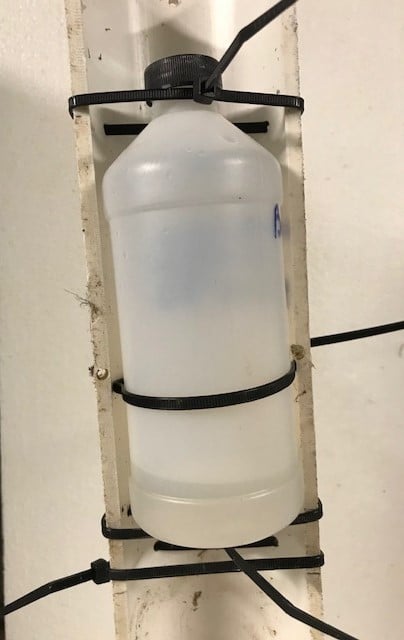
Picture 5: Bottle (without siphon and bent tubes) mounted on a split PVC pipe.
We used either 1-pint or 250 cc bottles. A 3” or 4″ PVC pipe was cut longitudinally (with a sabre saw) to form a mounting for the bottles. Cable ties were used to support the bottles at the bottom and to secure them at the top through holes drilled on the side of the PVC pipe edge. Then, a cable tie was fastened around the waists of the bottle to hold them in place. Picture 5 shows a bottle (without siphon and bent tubes) mounted on a split PVC pipe.
Also, refer to Picture 1 to see the spacing of the bottles of our prototype samplers installed in the stream (photo after a very significant rain — note debris). These small bottles have a height of 14 cm, so that on tower 1, the first siphon bottle is set to trigger the siphon at 7 cm above the base flow level. The second bottle up on tower 1 triggers at 21 cm, etc. Then, on tower 2 in the photo, the lowest bottle is set to trigger at 14 cm, the second bottle at 28 cm, etc. In other words, by use of multiple towers, it is possible to achieve reasonably close spacing between sample levels. A similar scheme would be used to achieve the desired levels with larger bottles such as the 1-pint size (which have a height of about 18 cm).
Tower Sampler
The split PVC pipes were fastened with cable ties to steel posts driven in the stream bed. After a rain and runoff event, stream samples were collected by cutting the single cable tie at the bottle waist and removing the bottle.
Sample Transfer
Remove the bottle cap and pour the sample into a secondary container using a funnel. Samples need to be swirled to stir up the sediment. Check each bottle to make sure all sediment is removed. If not, pour some sample from the secondary container back into the siphon bottle and swirl around again, then rapidly dump the sample into the funnel. (Make sure to rinse the bottle and the funnel after every transfer.)
Prototype Tower Sampler Demonstration
Historical stream hydrograph analyses indicated that most of the rain events yielded a stream rise of less than 45 cm (<18 in). Therefore, we elected to build 2 sample towers (with 3 sample bottles each) where the stream level trigger depths were roughly 7.1 cm apart on average (see below). The towers were installed near the centerline of the stream but slightly offset so that the second tower sampler would see direct current as opposed to draft current from the leading tower in the stream.
| Sample Bottle # | Trigger Sensor Depth, mm | |
| Base Flow | 97.9 | |
| Tower 1: | 1 | 152.7 |
| 3 | 295.7 | |
| 5 | 435.7 | |
| Tower 2: | 2 | 232.7 |
| 4 | 371.7 | |
| 6 | 510.7 |
This configuration provided us with a sufficient number of samples for large rain events (example: > 2 in. in spring) and a minimum of 2-3 samples for modest rain events (example: 0.6 – 1.5 in. in spring).
Example Rain Event:
May 22, 2020: Rain level = 0.69 in.
Soil Moisture = 0.304
“WHAT” Model RO = 0.14 in. (~ 20%)
Stream runoff hydrograph showing when tower samples were taken with corresponding TSS values is illustrated below in Figure 2.
Data Analysis
Since the tower sampler collects discrete samples on the rising portion of the runoff hydrograph an approximation is needed to estimate the total sediment loading for the complete runoff event. Using turbidity data from the Mayfly monitor located on this portion Broad Run stream in 2018 and 2019, we were able to develop a reasonably accurate method (85 – 90%) to estimate total runoff sediment loading. The detail on this method will be the subject of future papers. However, the essential key element of the method is to do a “flow-weighted average” of each sample using the runoff hydrograph and then extrapolate that to predict the entire runoff event sediment loading.
| Sample # | TSS | Relative Flow Zone Weighting |
| 1 | 143 | 16 |
| 2 | 562 | 25 |
| 3 | 731 | 161 |
| Flow Wt. Avg: | 664 |
The authors have developed an Excel-based “Sediment Estimator” that is used to calculate the total rain event sediment loading in a stream. Discussion of this topic will be featured in a future paper. Using this approach:
Estimated Sediment Loading = 664 * Total Stream Flow-RO * TSS Conversion ~ 4.4 tons
Confirmation of Sediment Loading Estimation Method
In order to test the validity of this estimation approach during a rain event, we developed a “Do-It-Yourself” DIY infrared instrument detector where the signal varies proportionally to the level of sediment loading in the stream (Figure 1, below). This device has offered a much more stable signal to noise ratio vs. the standard turbidity measurement. Details on the design and construction of this device will be the subject of future papers. Below in Figure 1 is a correlation curve that relates the DIY sensor output to TSS samples from the example rain event. The correlation is reasonably strong with an RSQ ~ 96% despite only having a few data points.
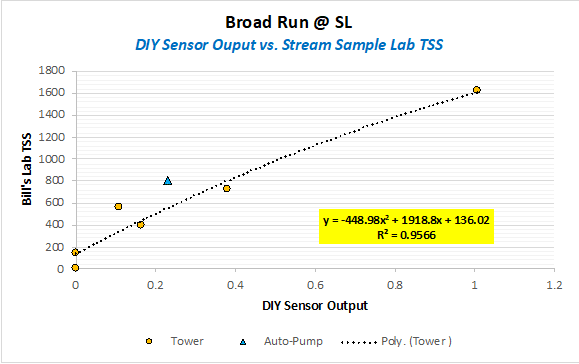
Figure 1.
The TSS vs. DIY sensor correlation above can be used to estimate the TSS in the stream throughout the rain event as illustrated in Figure 2 below. Notice that the TSS values for the Tower Samplers and Auto-samplers follow the predicted estimated TSS vs. time curve. Superimposed on the figure is the runoff hydrograph which illustrates the sharp rise in TSS from the samples caused by the rapid rise in runoff due to high rainfall rates.
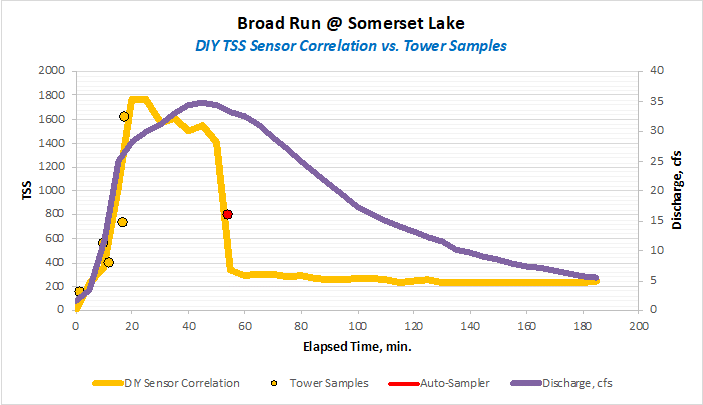
Using the TSS and hydrograph runoff curves an estimate can be made of the total sediment loading in the stream during the runoff event. For the May 22nd rain event, the analysis yields an estimated total sediment loading of 4.8 tons vs. 4.4 tons using our estimated method above.
Future Work
The early results presented above have confirmed the efficacy of using a tower syphon bottle sampler to obtain representative stream samples for offline analysis. Generally, many environmental working groups may not have the trained resources and equipment to perform TSS. That issue, coupled with the TSS lab process being labor intensive, suggests that many groups should consider using relatively low-cost laboratory “turbidity sensors” and then estimate TSS by using a rating curve or a 1.9X factor of Turbidity to TSS levels. The authors can assist in training and setting groups up.
Future work this area includes the following:
- Reconfirm and fine tune the total sediment estimation method.
- Develop a detailed Erosion Index correlation vs. Runoff Index and Total Sediment. This will assist in characterizing Broad Run erosion so that active commercial development upstream of Somerset Lake can be tracked to determine the impact on sediment loading.
- Assess the vertical TSS uniformity of the stream at various levels during the runoff event.
- Quantify the level of “sediment bed transport” observed.
Please feel free to ask questions in the comments section. If you wish to collaborate, please contact Marion Waggoner (mwag1@verizon.net) and Dave Yake (DEYake1980@gmail.com).
Jim Moore
I have a similar issue with the need to collect a water sample. We have an array of LEC water monitors in the various UNT’s into Great Marsh. One is downstream of the Turnpike service plaza and we are seeing the usual EC spikes correlated with the winter weather. However, a few are very large and don’t seem to be weather correlated hence the nee to get water sample since they are relatively short duration of a few hours or less.
I came across a low cost 12 Volt fountaintain pump that is perfect for pumping a water sample into a collection bottle. I built a 4 channel sampling system based on this pump with a Mayfly controlling four pumps. When the EC gets above a prescribed level the pump is activated for about 12 seconds, enough time to fill a 500cc sample bottle. The software in the mayfly resets when the EC drops below the set threshold and advances to the next port and runs on the next EC spike.
I attached a few pictures of the system I built. However I may have missed the weather events causing EC spikes.
If there is interest I can write up a blog with Mayfly code and construction details.
Jim Moore
can only add one image at a time
Jim Moore
..and here are the sample collection bottles