
A forest floor is a complex place. Throughout the depths of the litter and soil layers, dead organic material is broken down into nutrients and integrated into living organisms via microbial interactions
Pulses of water from precipitation help facilitate this transfer and play a critical role in biogeochemical cycling. Dead woody material, such as slash or downed stems of trees, provides habitat for many species, contributes to carbon storage, and controls overland hydrological flow.
Forest managers can decide the status of the forest floor and what material is left there. The amount of dead woody material to leave in specific locations can strongly influence forest processes and dynamics. It involves a set of decisions at the forefront of many forest management plans in temperate and boreal systems.
However, the impact of silvicultural treatment on the ecohydrology of the forest floor is vastly understudied. Collections of soil moisture, deadwood moisture, and soil temperature are often done with one-time, spot measurements. The remote location of experimental forests where such measurements occur means that reliable power sources and/or personnel are typically unavailable.
Understanding how management decisions regarding the forest floor may impact ecosystem processes is therefore difficult since long-term data on silvicultural impacts are sparse.
Initial Design
Our team first approached this challenge in the summer of 2017 with the idea of building a sensor network that could address several key questions related to how the forest floor affects nutrient cycling and the hydrological budget.
At that time, activities were underway at the Dartmouth Second College Grant to establish the northeastern site of the Adaptive Silviculture for Climate Change (ASCC) project in conjunction with the University of Vermont and United States Forest Service Northern Research Station.
The initial design of the experiment was to implement a series of three replicated silvicultural treatments and controls that could be monitored into the future to help explore optimal strategies for forest management under a changing climate.
While the central focus was on forest above-ground responses, the experiment’s replicated nature provided us with a natural template to establish a sensor network and ask questions related to forest floor dynamics.
Setup and Sensors
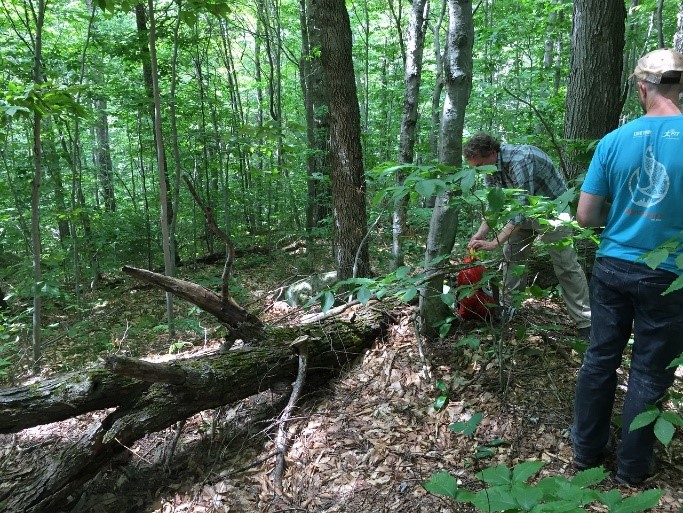
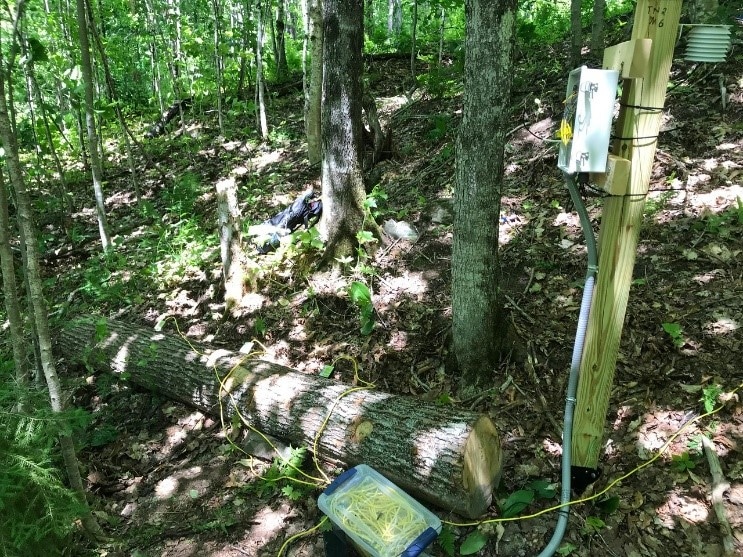
Initially, we designed a network to examine the immediate surroundings of a large fallen maple log (photo 2). The log was located at Hubbard Brook Experimental Forest, New Hampshire, in a study watershed where we could access historical soil and precipitation information.
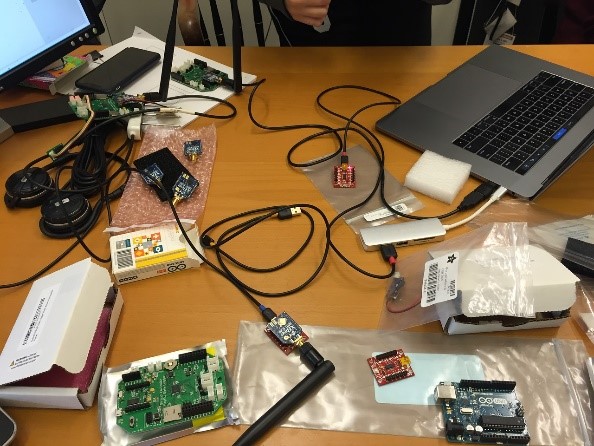
The basis for our network lay in the control of three Mayfly Data Loggers (photo 5). Each Mayfly controlled upwards of 20 soil moisture sensors placed around the log as well as drilled and inserted into the log itself.
The wired nature of this log led the team to name our experimental subject the “Frankenlog.”
The overall concept was to investigate how moisture dynamics changed within and around the log, both upslope and downslope, and examine how woody debris played a role in forest ecohydrology and related processes. Our team involved researchers from the University of Maine as well as the Watershed Sensing Laboratory at Plymouth State University.
- Acclima 315-L TDR
- Meter GS-3 VWC, EC, and temperature sensor
- Meter Teros-21 soil water potential sensor
- Meter ATMOS-14 air temperature, humidity, and pressure sensor
- Apogee SQ-110-SS Sun quantum sensor (PAR)
- Maxbotix HRXL MaxSonar WRS sensor (for snow height)
Code
The base script used to control the Mayfly Data Loggers stemmed from a number of available pieces of code provided by the EnviroDIY network. Essentially, our code included the capacity to take routine calls to each digital and analog sensor based on the Mayfly’s real-time clock, store data in a microSD card, and enter sleep mode to save battery when not in use (photo 3).
While adjusting the code for the number and type of sensors took some configuration, ultimately, we were able to collect roughly three months of Frankenlog data at 15-minute intervals during the summer of 2018. This information has been analyzed, and we have already published one peer-reviewed paper, with several more in progress.
Broadening the Scope
Once we had constructed a satisfactory proof-of-concept station at Hubbard Brook, we turned our eyes to the ASCC experiment at the Dartmouth Second College Grant.
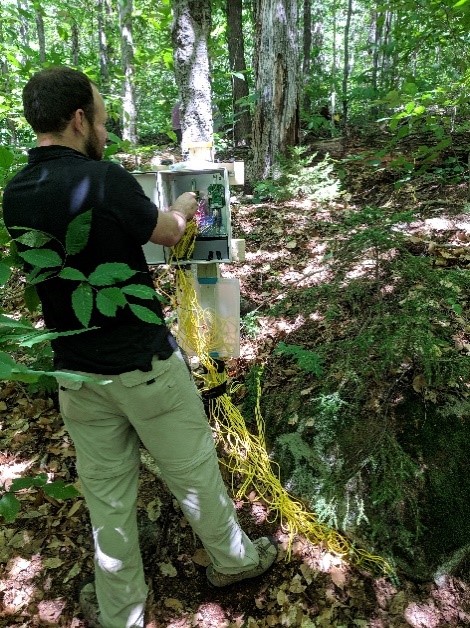
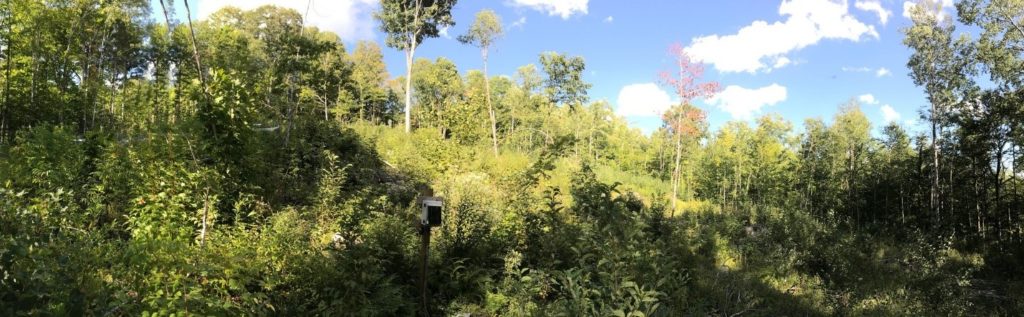
Instead of a single log, we broadened our scope to include twelve logs, placed in four distinct canopy conditions, ranging from intact canopies (photo 6) to large canopy gaps (photo 7). Each log was co-located with a sensor station driven by a Mayfly Data Logger. The code for operation was very similar to that installed at Hubbard Brook, but the number of sensors per log was reduced.
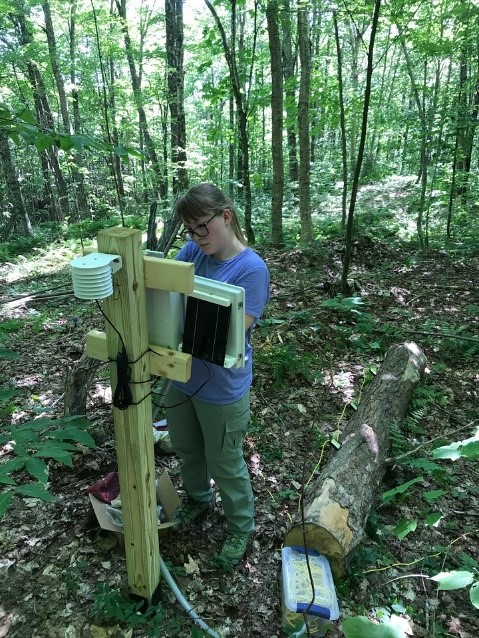
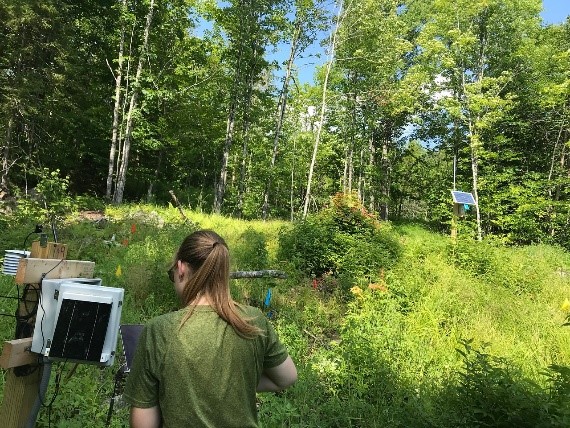
Each log had three time-domain reflectometry sensors inserted into the log, two soil matric potential sensors and two soil volumetric water content sensors located both upslope and downslope from the log, an air temperature, humidity, and pressure sensor located on the station post, and a photosynthetically active radiation sensor (photo 1). Power was delivered using 12-volt 9-amp hour batteries, charged with a 10W solar panel.
Progress in 2019 and 2020
We collected data throughout the growing season of 2019. Data were collected at each station at 15-minute intervals.
Generally, battery changes were necessary roughly once every two weeks. We configured two of the stations to be powered by larger marine batteries with a longer lifetime and provided 40w solar panels for consistent power supply over the winter.
We also built a receiver station containing a Mayfly with a Digi XBee 900Mhz radio module that could collect station data (photo 9). Each station was also provided with an XBee module and antenna to send data at cyclical intervals with the goal of eventually sending this data to an HTML repository via a cellular module at the receiver station.
While we were able to initiate this wireless communication for some stations, at the end of the 2019 field season we were unable to send data directly off-site. Our plans to address this element of the network in summer 2020 were foiled by the COVID-19 outbreak, but we plan to finalize this element in the 2021 field season.
Data from this 12-station network provides an intimate view of soil moisture dynamics in the forest floor. The field season of 2020 allowed us to examine fortuitous natural experiment: during August and September, our field site experienced a severe drought, and we have been able to investigate plant moisture stress and the influence of dead wood on surrounding soil moisture.
We now have four full months of data from the field season of 2020 and are in the process of documenting our findings and analyzing how forest canopy conditions influenced the forest floor.
Future Plans
As we look into the 2021 field season, we plan to continue collections at our 12-station network and also bring some other field sites online.
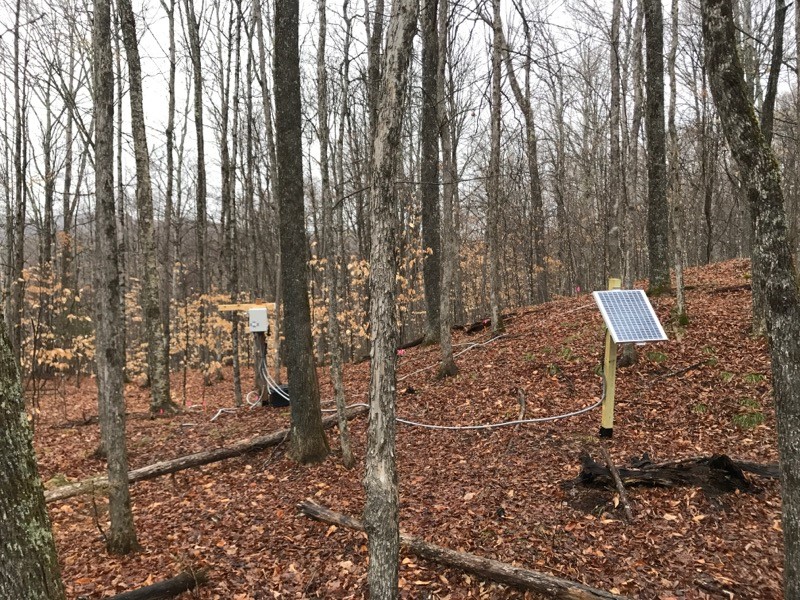
In October of this year, we installed two similar sensor stations at an experimental forest in Corinth, Vermont, that is the location of another silvicultural manipulation study (photo 8). At this site, the forest is being managed to reduce the impact of the emerald ash borer. While the borer has not been found within the study site, it has been located roughly five miles away, and we expect that the forest stand, containing upwards of 60% live ash trees, will be severely impacted.
In the spring, we will install an additional six stations. These stations will be similar to those at the Second College Grant but will not include an investigation into woody debris and be solely focused on soil moisture, microclimate, and phenology. Single logger stations have also been installed at Thompson Farm, aside the University of New Hampshire campus, Bartlett Experimental Forest in the White Mountain National Forest in New Hampshire, and Old Town Forest, near the University of Maine.
The growing reach of our terrestrial sensor network has led us to examine the inclusion of several other sensors and ideas. This winter, we plan to test trace gas sensors to monitor concentrations and fluxes of carbon dioxide in the soil and above dead woody material. We would like to install similar stations at other experimental forests in the Northeast so as to have a comparative network for a broader understanding of forest floor dynamics.
This effort has been made possible by the Mayfly Data Logger, which serves as the heart of each of our stations. We look forward to continuing our expansion of this network of sensor stations and are always looking for ways to further our understanding of natural processes with the help of this digital technology.
David Lutz is a research assistant professor in the Environmental Studies Program at Dartmouth College. You can reach him with a comment or question about this post using the form below.
neilh20
Fascinating the network. Thankyou so much.
I was just wondering if you where planning on describing any of the stations in more detail?.
I’d be interested in how you did the powering, and what was taking the power. Though the whole software architecture of the data flow, (and challenges you found) would be fascinating 🙂
Matt Barney
Excellent writeup, David. Thank you for sharing it!
-Matt
dan@wachusett
.
dan@wachusett
Very cool project David. I am wondering if you could share a list of hardware/electrical components that you used to power your Mayflies with marine batteries. I have one site that gets virtually no sun, so I am thinking that I could do a similar setup.