
Global Positioning Systems (GPS), like the new one for sale on the EnviroDIY Shop, come in handy for exploring rivers and how they work. Rivers work by moving water downstream, but how fast and how far?
It’s common to measure how fast water flows past you by using electronic equipment (or the tried-and-true method of using a stopwatch, a tape measure, and a floating banana*), and this measurement lets you predict the distance water travels over an hour, a day, or a week.
Travel distance is critical for studying many aspects of river ecosystems, and sometimes it’s more accurate to measure, not just predict, how far river water travels over time.
That’s where river drifters, and GPS, come into play. Drifters come in different shapes and sizes, and while a few are commercially available, most have been DIY inventions. Scientists from Stroud Water Research Center took the DIY approach when measuring the travel time of the Brandywine River while investigating algal dynamics.
Adding GPS to a Drifter
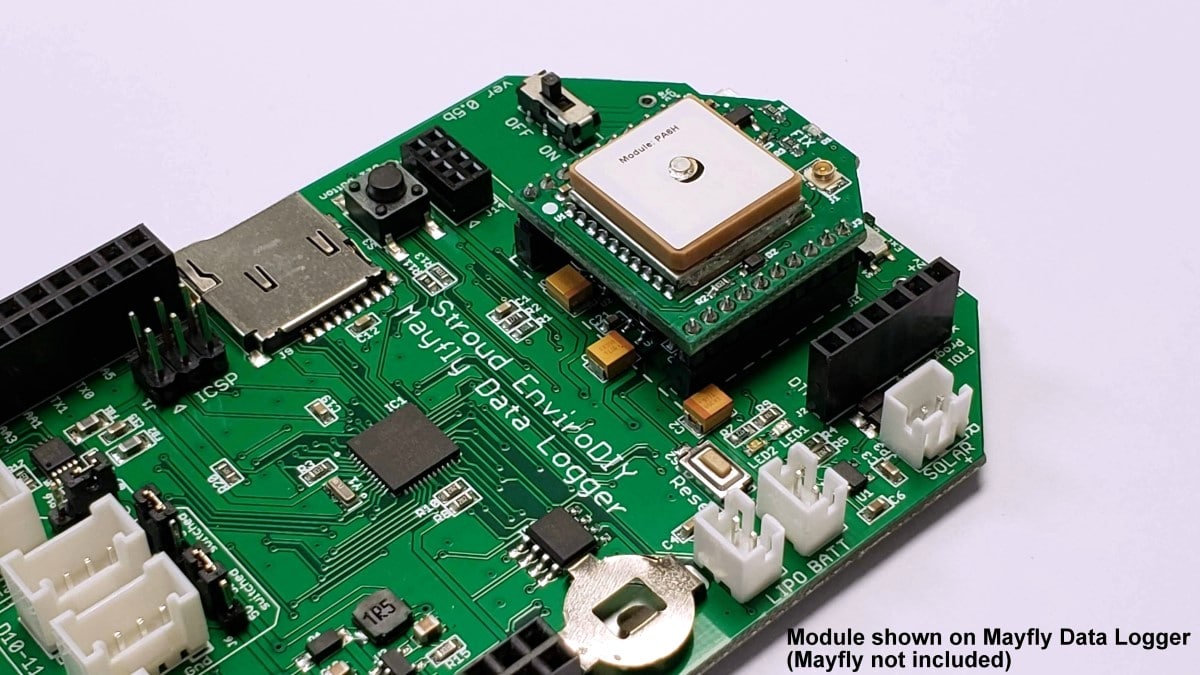
An EnviroDIY GPS module was attached to a Mayfly Data Logger and mounted inside the waterproof instrument housing of a HydroSphere river drifter. The Mayfly was programmed to record the GPS-derived latitude, longitude, and various measures of position accuracy every five minutes with this code. The drifter carried a secret weapon to help it rescue itself if it was drawn underwater and trapped by debris: a CO2 cartridge that would flood the HydroSphere with gas and float it to the surface for retrieval. This code shows this self-rescue feature combined with GPS.

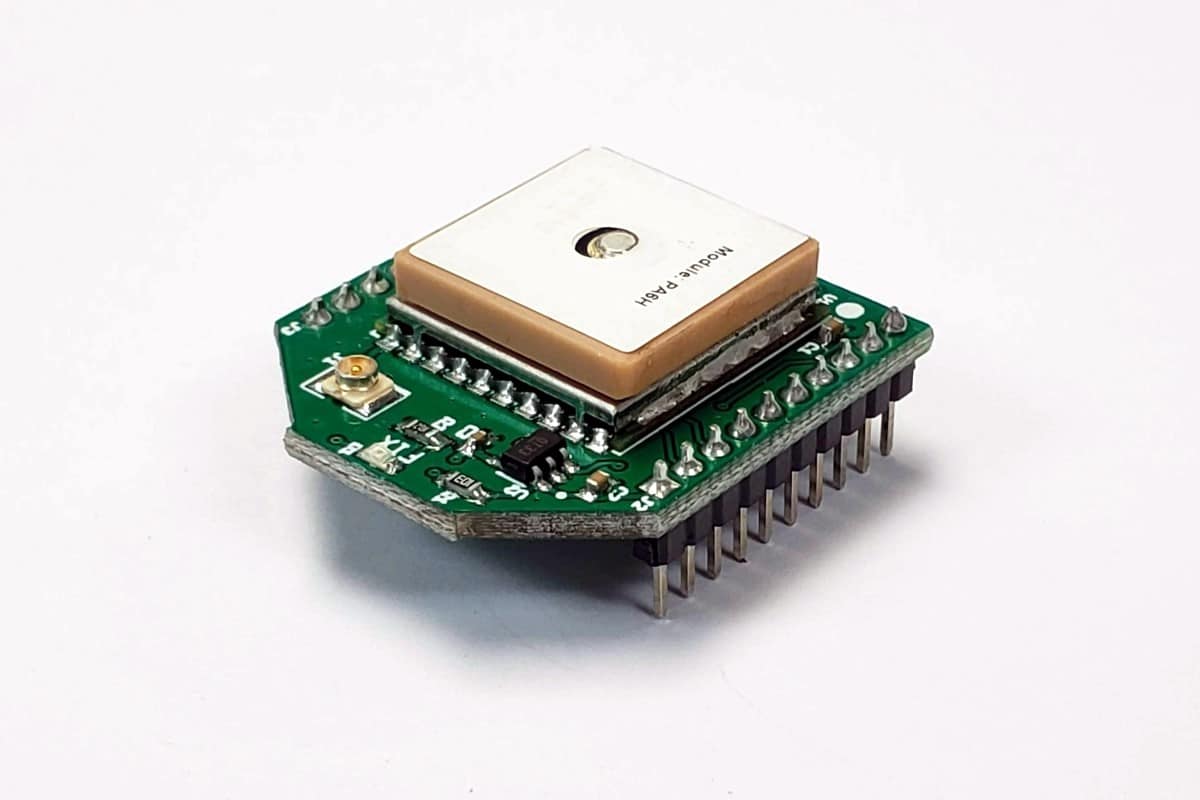
Top view of the EnviroDIY GPS module. 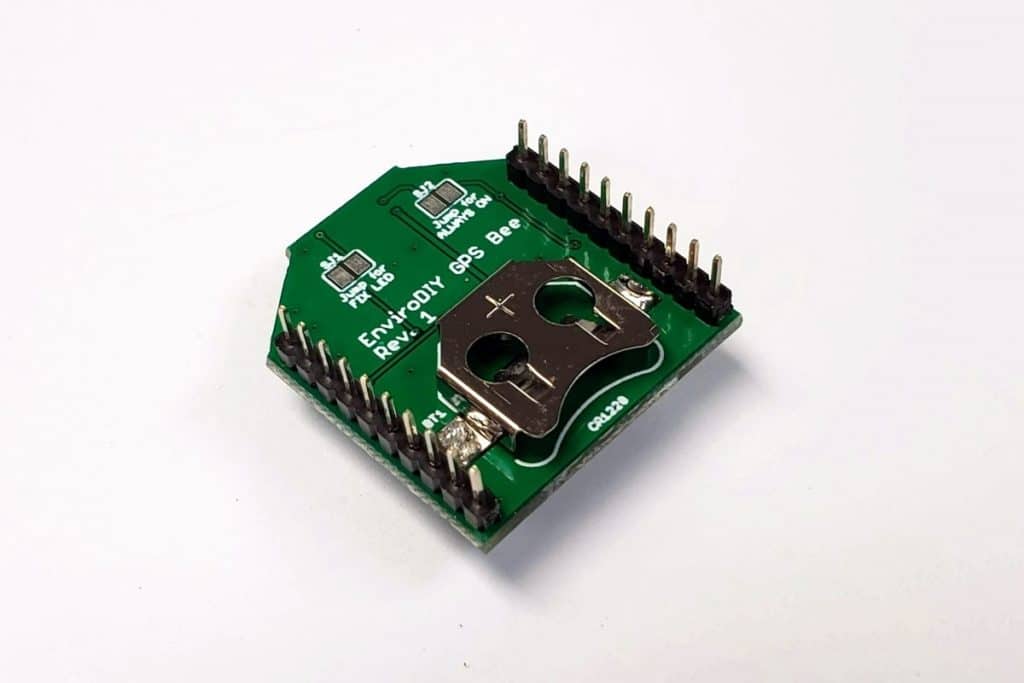
Bottom view of the EnviroDIY GPS module. A CR1220 battery must be purchased separately. 

Visualizing the Drifter Track
The drifter track was visualized in Google Earth by creating a KML file from the time stamps and associated latitude and longitude stored on the Mayfly Data Logger’s microSD card. You can do the same using the instructions below.
Start With a Template
Create a KML file by starting with an eight-column spreadsheet using the template below, substituting your own values for those highlighted, and copy/pasting the other columns down all rows. Save the spreadsheet as a tab-delimited text file (.txt).
| <Placemark><name> | 6/4/2019 12:00 | </name><styleUrl>#exampleStyleDocument</styleUrl><Point><coordinates> | -75.870 | , | 39.870 | , | 0</coordinates></Point></Placemark> |
| add a new row for each data point… |
Edit the Text File
Open the .txt file in a text editor (e.g., Notepad or Notepad++) and paste the following text at the top of the file:
<?xml version=”1.0″ encoding=”UTF-8″?>
<kml xmlns=”http://www.opengis.net/kml/2.2″
<Document>
<name>Document.kml</name>
<open>1</open>
<Style id=”exampleStyleDocument”>
<LabelStyle>
<color>ff0000cc</color>
</LabelStyle>
</Style>
Next, add this text to the bottom of your file:
</Document>
</kml>
Now save the .txt file and close it.
Rename and Open in Google Earth
Rename the file by changing the extension from .txt to .kml; open this KML file in Google Earth. Refer to this Google support page for more details and instructions on editing the KML file.
Drifting Down the Brandywine
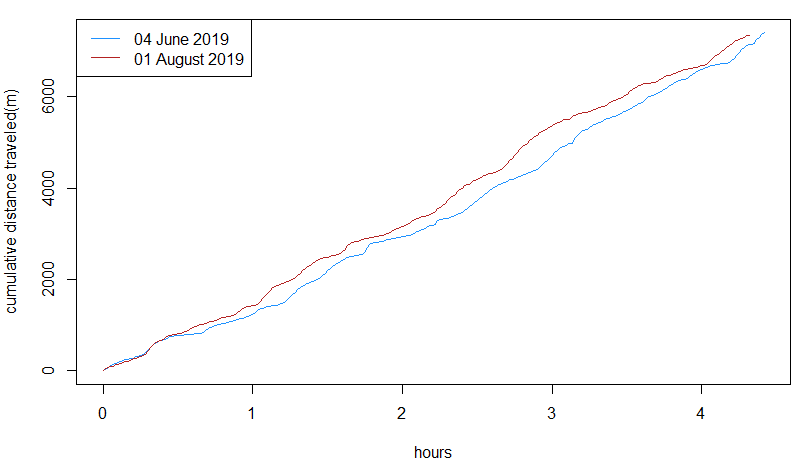
Further analysis of the data reveals heterogeneity in travel speed and differences between two deployments of the drifter. Travel time along this reach of the Brandywine River is useful for evaluating trends in plankton growth in the river.
The drifter also served as a “pace car” for the researchers because the mostly submerged drifter was more likely to stay with the original slug of water than a free-floating canoe pushed by the wind and surface currents. By collecting samples regularly over the eight-hour drift, the researchers were, in theory, repeatedly sampling the water they originally started with.
River drifters not only provide useful measurements of travel time and provide a “pace car” for researchers, but they can also be equipped with various sensors. For example, underwater light is a critical factor for many ecosystem processes and can be measured using a neutrally buoyant river drifter as this video shows.
Happy Drifting!
*Banana? What about oranges? In field tests of fruit drifters, bananas performed better than apples and oranges in matching the bulk flow of water (Hicks, unpublished data). Perhaps this is because the density of bananas is more similar to water or that the shape of the banana exposes more of the fruit to the mixed water column.