
The Problem
An EnviroDIY Monitoring Station, which includes a turbidity sensor, was installed in late May 2018 on the Broad Run Creek upstream of Somerset Lake. The Mayfly board enclosure with solar panel was installed in a moderately sunny location on the bank, but the sensors were located about 6 feet lower in elevation down in the stream bed. The stream bed at that point was partially shaded.
Approximately 3-4 weeks after deployment, we started to see a divergence of the relationship between the sensor calculated turbidity/TSS vs. TSS values for grab samples, when compared to carefully obtained initial data.
The sensor window had begun to foul with algae and possibly some fine clay particles. A thorough cleaning of the window was needed to restore the turbidity response to normal.
As the creek temperatures increased during the summer months, the sensor had to be cleaned after only 2-3 days to remove the deposits. In fact, we adopted the practice of going out immediately before a forecast rain to clean the sensor — otherwise we could not trust the data.
We learned that even with a clean sensor, we sometimes found debris (leaves, sticks, etc.) blinding the sensor after a significant rain. This situation greatly reduced our confidence in the turbidity data.
Solution Used to Reduce Fouling
We believed that there might be a simple solution to sensor fouling by debris might be to install some sort of shield upstream of the sensor. A short literature search of water flow patterns around obstructions showed many references of work which described how obstructions alter the flow of water. This has been an important subject extensively studied due to applications in construction and maintenance of bridges and other structures in the marine environment.
A recent reference which has excellent graphics to visualize the flow vectors around a circular cylinder. See Figure 1 in: A fundamental study of the flow past a circular cylinder using Abaqus/CFD, by Sato and Kobayashi, 2012.
The references show that the stream flow is divided around a circular cylinder obstruction and recombines into a homogeneous stream somewhere further downstream. We decided to test a hemispherical shield for ease of construction and installation.
Fabrication and Installation
1. Cut a length of 4″ PVC pipe cut in half along the long axis. Use an electric sabre saw (or a band saw in the unlikely event that one is available). Use leather or Kevlar gloves for hand protection and use extreme caution with the power tool. Also, safety glasses are highly recommended. The length of the shield should be enough to extend from the stream bottom to probably 1 foot above the top of the sensor package.
2. After the shield is cut, drill several holes (suggest approximately 1″ diameter) in the shield to provide some flow through the shield to minimize stagnation behind the shield. See photo.
3. Drive a length or rebar or a steel post into the stream bottom approximately 8-10 inches upstream of the sensor package (distance based on our visual observations on the Broad Run stream).
Note: The most practical way for us to determine where to locate the shield upstream of the turbidity sensor was to first install a shield in a test location and then observe the path of debris as it passed downstream past the shield. Therefore, we visited the stream immediately after a rain and observed the paths of occasional floating debris and leaf pack as these objects were swept downstream past the shield.
Based on the literature and from personal observations, we expected to divert large particles (debris) from the sensor, while at the same time the stream flow patterns with the small particles most responsible for turbidity (light scattering) would recombine a short distance downstream after being divided by the shield. We visually estimated the distance downstream at which when essentially all debris was still deflected away from the sensor.
In the case of the stream we studied, this distance was at least 12″. However, if mud/clay was dispersed in the water upstream of the shield, the stream flow lines with the fine particles converged again into a homogeneous appearing stream (visual observation) in about 4-6″. So, in order to get representative turbidity data (while also deflecting debris), we located the sensor approximately 8-10 ” downstream of the shield.
4. Anchor the shield to the rebar or post using plastic cable ties. The shield was oriented so that the open half pointed directly downstream. See photo. The position was further stabilized by moving some of the small cobbles on the stream bottom up against the bottom of the shield. However it is important not to put too many cobbles around the bottom of the shield to avoid significantly modifying the flow profile.
5. We turned the turbidity sensor to “look” essentially perpendicular across the stream flow direction to collect the most representative turbidity data.
-
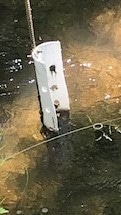
- View of shield from downstream side.
-
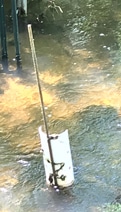
- View of shield from upstream side.
Results of the Shield Installation
The shield has worked really well to eliminate sensor fouling by debris. We have not seen fouling of the sensor with debris over a wide range of stream flows (from baseflow to large rain runoff events).
An unexpected positive result of the shield has been significantly less fouling of the sensor optical window by fine particles (clay) and possibly also algae. We can only postulate possible reasons for this. The most likely reason seems to be that the division and recombination of the water by the shield results in sufficient additional turbulence to sweep away the fine particles or any biomass prior to its deposition.
The result may be different in a different stream with different flow conditions and more or less sunlight reaching the area of the sensor window. Each installation should be tailored to that particular location and stream.
Watershed Hydrologic Analysis Team (WHAT): Marion Waggoner / Dave Yake