
Management of the EnviroDIY Monitoring Station includes quality control practices, sensor cleaning, station maintenance, power issues, data curation, and other logistical issues associated with keeping a monitoring station functioning properly. Important considerations in overall station management are:
- For quality control, monitoring station data should be cross-checked by conducting on-site measurements with calibrated handheld probes.
- For quality control, all monitoring station data should be backed up on a secure server or hard drive.
- Sensor cleaning should be done according to what the data dictate (i.e., if data indicate fouling, sensors should be cleaned).
- Battery levels below 3.6 V indicate that monitoring station function is at risk and alternative power options should be explored, such as a larger solar panel or occasional battery swaps.
- For quality control, maintenance and sampling should be documented using the Field Visit Data Form or in waterproof field notebook. Copies of field data sheets and/or notebooks should be made on a regular basis and stored in a secure location.
8.1 Quality Control
- Consult the EnviroDIY Monitoring Stations – Quality Control Quick Guide for detailed quality control protocols.
- See the EnviroDIY Monitoring Stations – Field Visit Data Sheet Tutorial for detailed instructions on completing the EnviroDIY Field Visit Data Form.
- View a video tutorial on performing quality control at your monitoring station site.
8.1.1 Field Visit Documentation
Any time a visit is made to a monitoring station it is recommended that sensor cleaning activities, staff gauge height, photos of site and station conditions, and any other maintenance and/or monitoring activities described in section 8.2, as well as supplemental data collection activities (e.g, discharge measurements and grab sample collection; see Supplemental Sampling, Rating Curves, Loads) be documented using the sample Field Visit Data Form (Table 8.1.1.1) or in a field notebook.
Back up copies should be made of data sheets or field notebooks on a regular basis.
In addition to basic quality control, documentation of all activities associated with monitoring station management will allow identification of issues and support improvements to the management process.
To ensure integrity of the data, it is recommended that data sheets be printed on weather resistant paper (e.g., Amazon: “Rite in the Rain All-Weather Copier Paper, 8 ½” x 11″, 20# White, 200 Sheet Pack (No. 8511)”. It is also recommended that data sheets be completed using a graphite pencil — ink pens may not be effective when used on the weatherproof paper. A waterproof field notebook (e.g., Amazon: “Rite in the Rain All-Weather Hard Cover Notebook, 4 3/4″ x 7 ½”, Yellow Cover, Journal Pattern (No. 390)”) can be used instead of field data sheets, however, it should be noted that without a field sheet guide it can be easy to forget key pieces of information.
Table 8.1.1.1. Description of Field Visit Data Form
| Datum | Explanation |
| Name(s) | Names of individuals conducting the work |
| Site ID | ID assigned if a monitoring station was deployed in association with the Delaware River Watershed Initiative |
| Stream Name | Name of stream |
| GPS (Lat/Long) | Site coordinates in Decimal Degrees |
| Photos (Yes/No) | General record of whether photos were taken — a repository for these photos may be developed |
| LoggerID | Running tally of all EnviroDIY monitoring stations that have been built and deployed. Each individual monitoring station has a specific SL number, e.g., SL### |
| Location | Simple description of general site location, e.g., nearby bridge crossing or confluence with another stream |
| Date, Time, AM/PM, EST/EDT | Date on which site visited; Time at which form was completed; AM/PM; Eastern Standard Time = fall/winter, Eastern Daylight Time = spring/summer |
| General Notes/Photo Descriptions | Space to record information about the specific visit to the site and/or to describe photos that were taken |
| SITE OBSERVATIONS | |
| Staff Gauge Height (m), Time, AM/PM, EST/EDT | Water level on staff gauge measured in meters; Time at which measurement recorded; AM/PM; Eastern Standard Time = fall/winter, Eastern Daylight Time = spring/summer |
| Sensor-Reported Water Depth (mm), Time, AM/PM, EST/EDT | Depth reading from CTD sensor in millimeters; Time at which measurement recorded; AM/PM; Eastern Standard Time = fall/winter, Eastern Daylight Time = spring/summer |
| Precipitation | Amount of precipitation |
| Water Clarity | Coarse assessment of water clarity |
| MONITORING STATION MAINTENANCE | |
| Sensors Submerged? | If sensors are not submerged or partially submerged it may be necessary to consider repositioning the sensors |
| Location of Sensors Changed? | Documentation of any re-location of sensors. If rating curves are being developed moving sensors may require assistance from Stroud Water Research Center |
| Cleaned Sensors? Exact time | Important to document exact time when sensors were cleaned – allows reference to specific spot in time-series data |
| Retrieved Memory Card? | Memory card needs to be removed to supplement online data if gaps exist or if online data are not available |
| Changed Batteries? | Batteries may need to be changed if solar charging is inadequate — record of this will help characterize site conditions |
| Cleaned Solar Panel? | Solar panel may collect dust or debris; record of this will help characterize site conditions |
| Other monitoring station maintenance? | Describe any other situational issues |
| GRAB SAMPLE INFORMATION | |
| Grab Sample Taken? | Record of collection of sample |
| Sample Number | Specific number listed on grab sample bottle — unique number for every bottle — this is an important detail to record |
| Bottle Type | “Square Nalgene” 1 L or 500 mL |
| Lab Sent To | Lab that will analyze sample, usually this is the Stroud Center |
| Time | Exact time (to the minute) that the grab sample was collect — this is an extremely important detail to record because it will allow the grab sample data to be matched with specific sensor measurements at the time grab was collected |
| Volume | Grab samples will either be 500 mL or 1 L |
| Date Shipped | Date when sample was delivered to FedEx for shipment |
| Chain of Custody # | Specific number from Chain of Custody form provided in grab sample shipping kits |
| IN-SITU MEASUREMENTS | |
| Field Meter Brand/Model/Serial# | Record of the instrument used to collect the data |
| Was meter calibrated? Standard, Calibration Result | Record of calibration |
| OTHER PARAMETERS (e.g., NITRATE, PHOSPHATE, CHLORIDE, pH, DO) | |
| Parameter, Brand/Model, Result | Record of any other measurements using kits, meters, or other methods |
| OTHER INFORMATION | |
| Field duplicate Taken of Grab Sample? | Sometimes grab samples may be collected in duplicate for quality control purposes |
| Performed Cross-Section Survey? | Cross-section survey is done when monitoring station is installed — mapping of channel profile for predicting cross-sectional wetted area for use in calculating discharge |
| Flow Measurement w/ Flow Meter? | Discharge measurements collected using a flow meter |
| Flow Measurement w/ Neutrally Buoyant Object | Discharge measurements collected using a timed float of a neutrally buoyant object |
| Flow Measurement w/ another method? | Discharge measurements collected using any number of methods including timed fill, salt-dilution, etc. |
8.1.2 Data Backup
View a video tutorial on downloading data (i.e., backing up data) at your monitoring station site.
Although data can be stored on Mayfly logger’s microSD card and the Monitor My Watershed data portal also has long-term data storing capacity, data should be backed up to a secure hard drive or server on a regular basis. Recommended data back-up frequency is every six to eight weeks if data are transmitted to the data portal and every two weeks if data are only stored on the microSD card. This process ensures that long term data records are secure even if damage to Mayfly Data Logger, microSD card, or a website malfunction occurs.
Downloaded data files should be filed chronologically and each file title should include a unique identifier for the particular station and the date range or download date of the file.
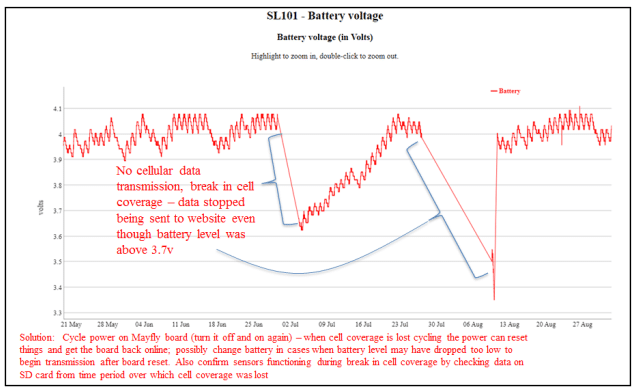
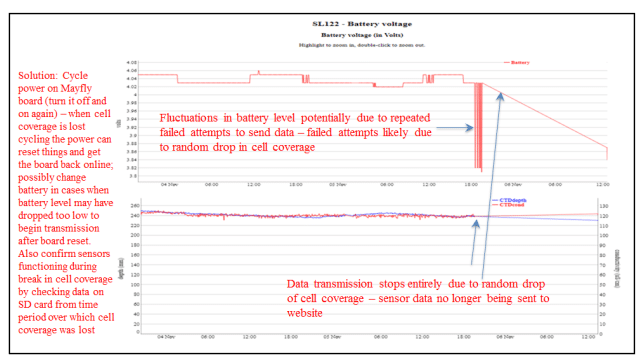
Some monitoring stations have intermittent cell coverage which could cause data transmission to the Monitor My Watershed website to stop. When this happens, sensor data will continue to be stored on the microSD card and missing data can be retrieved from it. Any data recorded on the card during a cellular outage will not be transmitted to the website once the cellular coverage returns.
Regardless of whether a monitoring station is online, sensor data will always be stored on the microSD card; therefore, if data stop transmitting to the website due to cell coverage issues, the complete data set can still be accessed via the microSD card. To download data from the microSD card:
- Open the logger box.
- Turn off the Mayfly Data Logger.
- Remove microSD card from board.
- Insert blank microSD card (so that data can continue being recorded).
- Turn the Mayfly Data Logger back on.
- Insert microSD card (the one you just removed) into a standard SD card adapter.
- Insert adapter into appropriate port on computer.
- Save data file to secure hard drive or server with the recommended format: SL#_mm-dd-yy.
- Delete data from microSD card for return to Mayfly Data Logger.
- Open data in Excel and graph as needed.
8.1.3 Sensor Cross Checks and Calibration
The Meter Hydros 21 CTD is factory-calibrated and cannot be recalibrated by the end user. However, these sensors can foul, malfunction, or get damaged, therefore, quality control cross-checks are highly recommended using independently calibrated instruments.
All quality control measurements should be recorded in the “In-situ measurements” section of the Field Visit Data Form or in a field notebook.
Any discrepancies between monitoring station data and data collected using hand held meters and other instruments should be further investigated. If monitoring station data are identified to be inaccurate, consult the sensor user manual or the manufacturer of the sensor and consider whether the observed inaccuracy is acceptable, if there is any way to fix the problem, or if sensor replacement is necessary.
These cross checks of monitoring station sensors should be done on a quarterly basis and more frequently if accuracy of data is questionable. A certain level of error is inherent in the monitoring station sensors and in all handheld sensors. There is no defined limit specified here for what is acceptable in terms of variability in these measurements. More importantly, measurements should always be documented and evaluated in the context of the specific project intentions for data usage. Furthermore, natural ranges of parameters should be understood so that departures from these can be identified and investigated.
Cross Checks for Conductivity, Temperature, and Turbidity
For conductivity, temperature, and turbidity, independently calibrated hand-held meters (see the Commercial Sensors in the appendix) should be used to cross-check the monitoring station sensor accuracy for these parameters. See the EnviroDIY Monitoring Stations – Quality Control Quick Guide for step-by-step instructions.
Cross Checks for Water Depth
To check the accuracy of depth measurements from the CTD sensor use a metric ruler or meter stick to measure depth from the window of CTD sensor (where pressure transducer is located) to the water surface. This hand-measured depth reading should be similar to the CTD depth sensor reading – any substantial difference between the two is a red flag that the pressure transducer is damaged or malfunctioning.
However, it should be noted that the CTD sensor is not designed for measuring absolute depth with high precision. Instead, it is designed to measure changes in depth, which is how it is being used here (i.e., for tracking changes in discharge). Therefore, the metric ruler measurement of sensor depth should be used as a guide in tracking sensor function; the specific depth it reads should be consistent and predictable in accordance with changes in water levels.
If this is found to not be the case then the sensor may not be functioning correctly and assistance should be sought via the sensor manufacturer or the EnviroDIY forums. See the EnviroDIY Monitoring Stations – Quality Control Quick Guide for step-by-step instructions.
To ensure that the CTD sensor can be re-positioned at its original depth after being removed purposefully or by natural causes (e.g., storm flows), a staff gauge and/or stream bottom rebar can be installed. An “Offset” is then calculated that represents the difference in water depth as measured by the staff gauge or stream bottom rebar (for info on staff gauge and rebar installation see section 6) and as measured by the CTD sensor.
This offset should remain the same over time and at different water depths. Any substantial changes to this offset indicate either a problem with the CTD sensor or with the staff gauge or stream bottom rebar.
If the pressure transducer in the CTD sensor were to malfunction, get damaged, or removed from the stream this offset can be used to ensure that when the CTD sensor is replaced or re-installed that it can be positioned at the exact same depth at which it was previously positioned.
Consistency in depth readings (i.e., positioning the CTD sensor at a consistent depth) is critical for developing rating curves and conducting analyses of the continuous depth data.
Cross Checks on Data Trends and Patterns
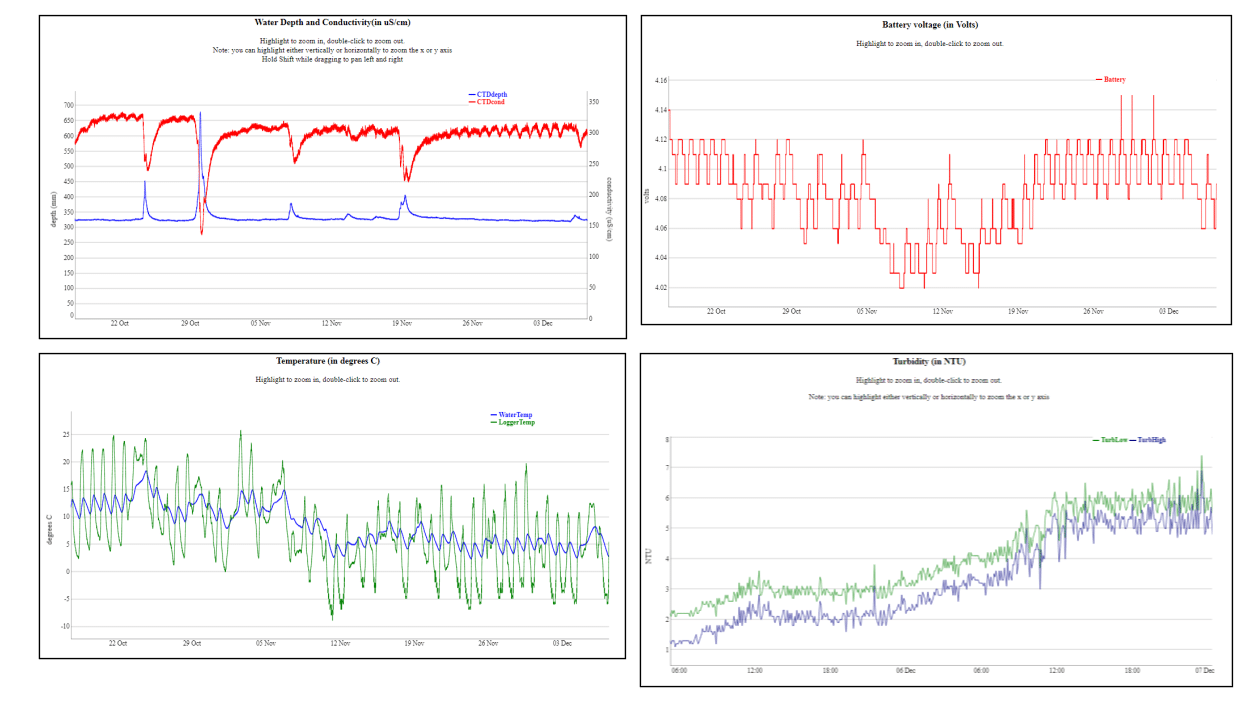
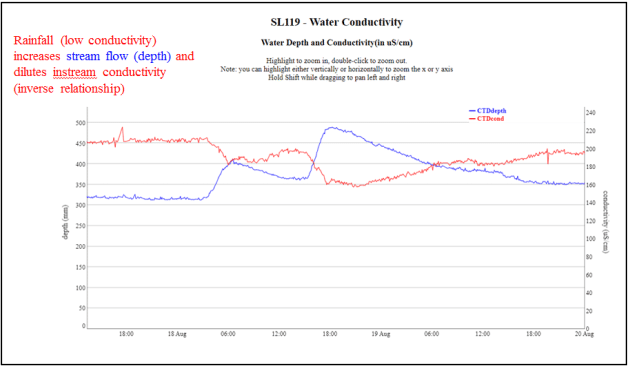
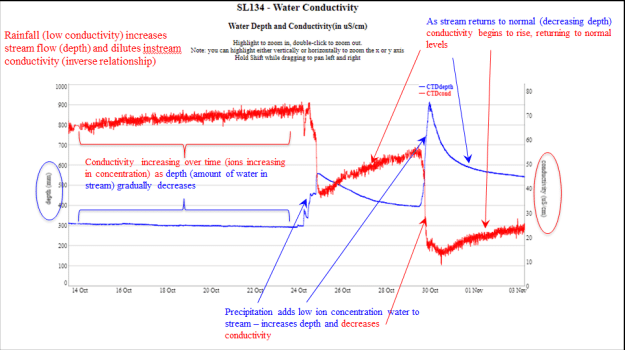
To ensure reliability of monitoring station data, data trends and patterns should be regularly evaluated. Graphical displays of data and assessment of the data in the context of the specific site conditions and ecological expectations should be used as a quality control measure to ensure data reliability.
Issues and problems to look for in data-quality assessment are extensive, but there are specific common issues that can be considered when troubleshooting for problems in sensor data. See Data Patterns and Troubleshooting in the appendix for details.
If monitoring station data appear suspicious (outside of normal range for the site, erratic, etc.) cross-checks with other calibrated sensors should be done immediately. If monitoring station data appear normal, cross-checks with handheld sensors should be done quarterly as a general quality control method.
8.2 Monitoring Station Maintenance
View the EnviroDIY Monitoring Station Parts List
Please see below for detailed maintenance protocols or consult the EnviroDIY Monitoring Stations – Maintenance Quick Guide.
For detailed instructions on completing the EnviroDIY Field Visit Data Form, read the EnviroDIY Monitoring Stations – Field Visit Data Sheet Tutorial.
View a guided video tutorial explaining sensor maintenance.
To ensure data from the monitoring station are accurate and continuous it is necessary to:
- Keep sensors clean and area around sensors free of debris.
- Keep area around logger box clear of vegetation, debris, and insects.
- Keep the solar panel clean and exposed to as much sunlight as possible.
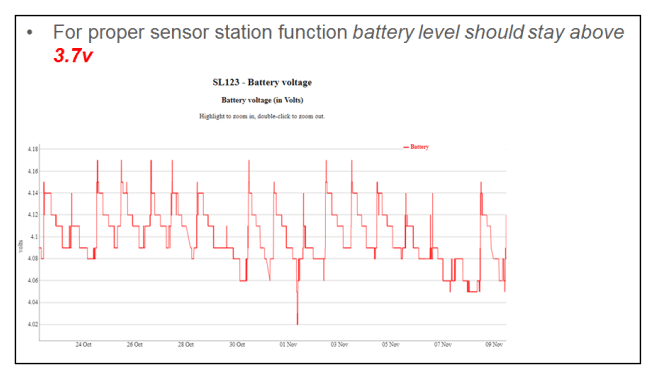
- Maintain battery level and cellular transmission of data by ensuring the battery is > 3.7 V.
See Maintenance Checklist in the appendix for monitoring station maintenance activities and timing of these activities. The key issues in maintaining a monitoring station are:
- Logger box and Mayfly Data Logger
- Functionality of the monitoring station is suspect if battery level falls below 3.6 V.
- Any moisture inside the logger box can cause logger board malfunction.
- Cycling the power (turn board off, pause 5 seconds, turn board back on) is a common fix for loss of cellular transmission and other miscellaneous issues.
- Turbidity sensor
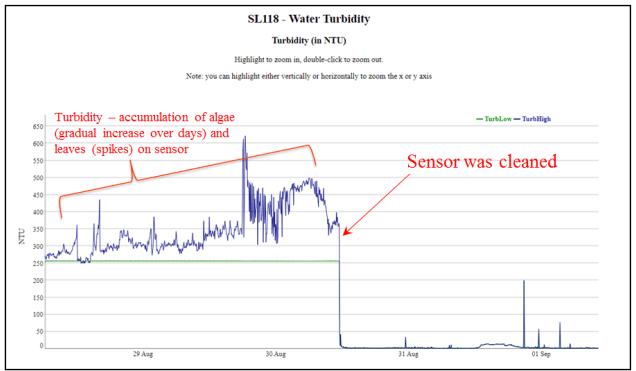
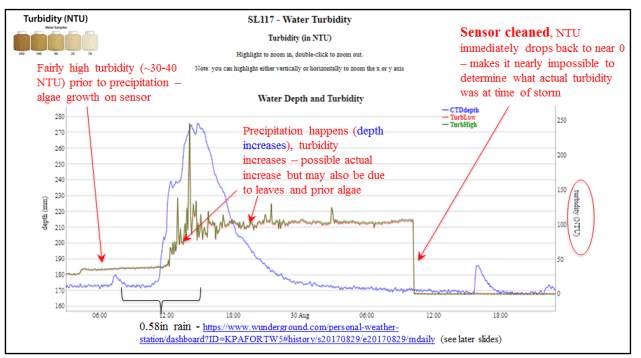
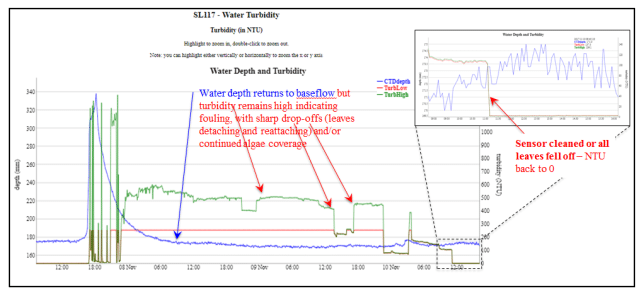
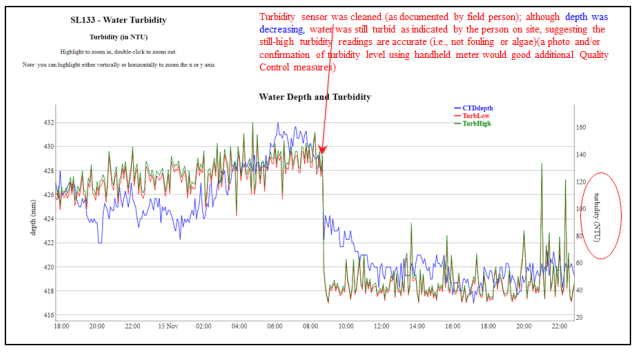
- Turbidity sensor is particularly vulnerable to fouling: any debris, sticks, leaves on or near it, or algae that grows on it will cause false high readings and degrade data quality.
- Data from turbidity sensor can be affected by objects in its field of vision (38 cm); this can include debris and sediment piled up around or on the sensor and algae growing on the sensor.
- Because of the extended field of vision of the turbidity sensor, turbidity data are suspect when water level is less than 30 cm.
- CTD sensor
- The pressure transducer that measures water depth can be damaged if ice forms on the sensor.
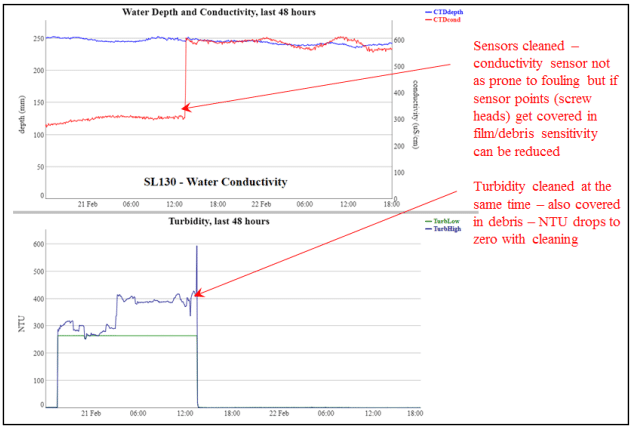
- The CTD sensor is not as prone to fouling as the turbidity sensor; however excessive debris accumulation on the conductivity Wenner array (four screw heads) will cause inaccurate conductivity readings.
- In rare cases the Meter Hydros 21 CTD sensors could have a factory production issue that affect data accuracy. Quality control checks with calibrated handheld sensors (see Monitoring Station Management) should be used when data are suspect.
8.2.1 Cleaning Sensors In-Stream
Most of the time sensors can be cleaned without removing the sensor bundle from the stream. Depending on the site and stream conditions, and depending on weather and any other environmental influences or unforeseen technical problems with the stations, sensor cleaning frequency may range from weekly to monthly.
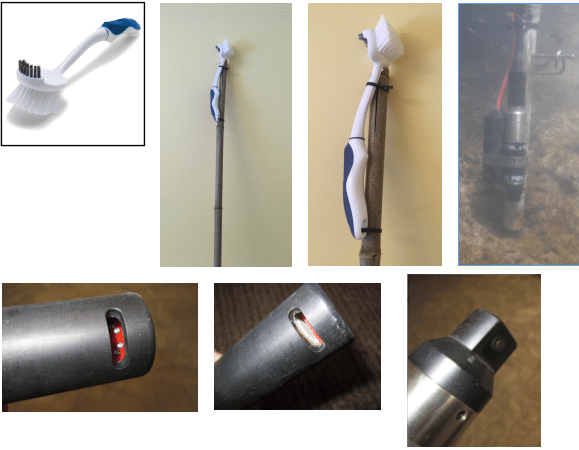
The Meter Hyros 21 CTD sensor cleaning involves scrubbing the semi-enclosed parts of the sensor (four point Wenner array shown in Figure 8.2.1.1) with a scrub brush to remove any accumulated dirt and debris. Cleaning the CTD sensor may not be necessary on a regular basis and is dependent on whether debris accumulates inside the partially enclosed part of the sensor.
To clean the sensors in-stream:
- Clear all accumulated debris on the stream bottom away from the sensors using hands and feet or a tool if necessary.
- Remove all large pieces of material (leaves, sticks) from the sensor bundle by hand or with the long bristles of the sensor brush.
- Use the longer bristles of the sensor brush to gently clean the side slots on the CTD sensor (Figure 8.2.1.1).
- If there are any sticks or hard objects wedged in the slot make sure to remove them carefully so as to not damage the pressure transducer (the white disc in the CTD sensor).
- Use the long bristles to clean the four screw heads inside the side slot (these are the points at which conductivity is measured). Use a Q-tip to clean the screws if necessary, making sure not to touch the white pressure transducer disc above.
- Use the short stiff bristles of the sensor brush to clean the signal window on a turbidity sensor (Figure 8.2.1.1).
- If a sensor brush is not available, using a foam soft plastic bristle brush or your fingers is usually acceptable for cleaning the sensors.
8.2.2 Removing Sensors from Water
If you need to remove the sensor bundle from the water for proper assessment or cleaning, do the following before removing it:
- Record the orientation of the sensors in the stream and note the position of the PVC conduit with regard to the top of the steel mounting stake. Also note the position and orientation of the mounting pin. When you return the sensor bundle to the stream you will need to position the sensor bundle with the same orientation and at the same level to ensure consistent data.
- If necessary, remove tent stakes and zip ties securing the sensor cables to stream bottom and tree roots. This loosens the sensor cable so the sensors can be brought to the stream bank.
- Remove the mounting pin; it functions like a standard safety pin.
- Slide the sensor bundle off of the steel stake.
To remount the sensor bundle (Figure 9.2) on the mounting stake:
- Make sure orientation of sensor bundle is the same as it was before you removed the sensor bundle.
- Slide sensor bundle (via PVC conduit) back onto the steel stake.
- Match holes in PVC conduit up with holes in steel stake at the same vertical level as before.
- Slide mounting pin through both sets of holes and lock mounting pin.
8.2.3 Clearing Around the Station
Similar to the sensors, the logger box, solar panel, and associated components will require regular maintenance. All debris and vegetation should be cleared from around and above the logger station.
The logger box is waterproof but it should be opened periodically to confirm that no moisture has entered and that the Mayfly Data Logger and all other internal components are intact.
Vegetation should be cut back from around the logger box and solar panel. Although the logger box is fully sealed from the external environment, vegetation can get in the way when opening the box and can possibly introduce water, insects, and debris.
Anytime the logger box is opened it is important when closing the box to ensure that there is no grass, leaves, stems, or other debris breaching the seal: this debris will allow moisture into the box and damage the electronics.
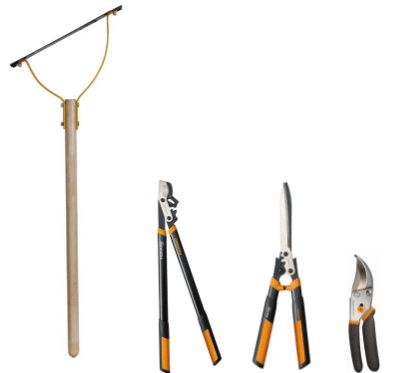
Vegetation covering the solar panel can reduce solar exposure and can cause additional debris and dust accumulation on the solar panel. Vegetation should be cut back on a regular basis from beneath and around the logger box and solar panel using any number of different tools (Figure 8.2.3.1). Clean dust and debris from solar panel with your hand or with a soft cloth.
8.2.4 When to Clean Sensors
Generally, sensors need to be cleaned on a weekly basis and sometimes more frequently during the fall or during storms when leaves and debris are abundant.
If the small conductivity-measuring screw heads in the CTD sensor becomes covered in silt, algae or other debris the data will be affected. This type of fouling does not usually occur quickly so the CTD sensor will usually produce accurate data for weeks (or even months in some cases) without needing to be cleaned.
8.2.5 Freezing Risk
The issue of highest concern during winter is damage to the pressure transducer in the Hydros 21 CTD sensor. The pressure transducer, as the name implies, is sensitive to pressure changes, so when water expands during freezing the pressure of the ice directly against the pressure transducer can damage it. If freezing does occur around the CTD sensor, then data will likely be inaccurate during this period time and should not be used. Depth data will be suspect and should be closely checked after the ice melts to determine if the sensor was damaged. Temperature and conductivity data should return to normal but should also be checked to ensure accuracy after the ice thaws, as these can be affected if the pressure transducer is damaged.
The shallower the water in which sensors are positioned, the higher the risk of freezing. Monitoring air and water temperatures during the winter can be important, especially in cases where sensors are located within the part of the water column where freezing may occur. Freezing risk is generally highest in small streams where there are not deep locations available for sensor placement, but freezing may also be a risk for deeper sensors during severe and extended low air temperatures when ice layers get thicker than normal.
Ice that forms at a depth above the sensors is not a high risk to sensor integrity, but this can make it difficult to access sensors. If the ice has to be broken with a hammer or chisel there is risk of damage via direct contact of the hammer/chisel with the sensors and/or sensor cables. There is also a risk of damage to sensors through shifting pieces of ice as they are broken and through possible damage from the shock of the hammer or chisel.
If freezing of the water surface is an issue and cleaning sensors during this time period is important it is recommended that ice layers be removed on a frequent enough basis so as to not require a hammer or chisel for breaking the ice (i.e., remove ice when it can be broken by hand). Clearing ice at this frequency will ensure that the sensors are accessible for cleaning and ensuring accurate data.
8.2.6 Power Management
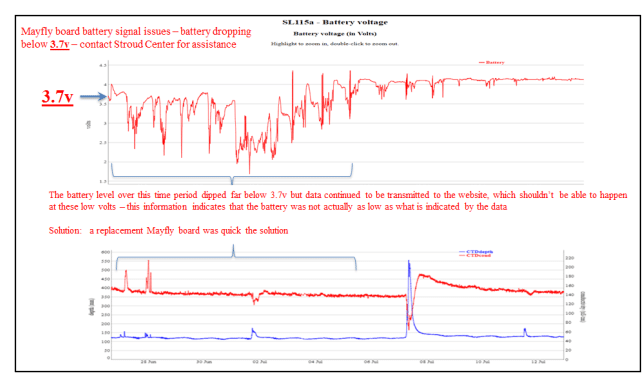
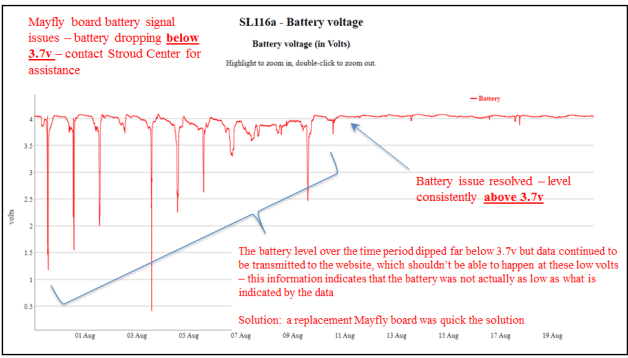
The target voltage level for the battery is 3.7 V or higher. Below 3.55v the station may lose functionality and data will stop transmitting to the web data portals. The typical battery voltage pattern is for the battery to charge during the day and slowly lose a little power during the night.
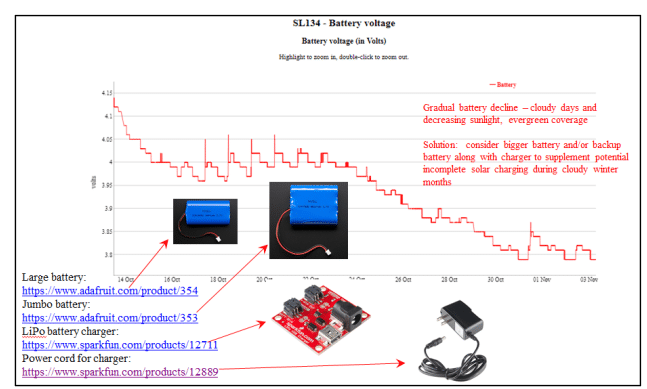
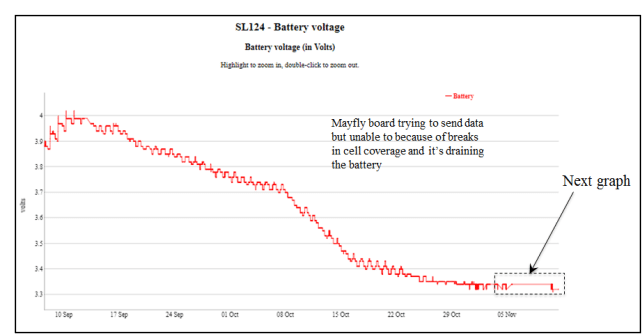
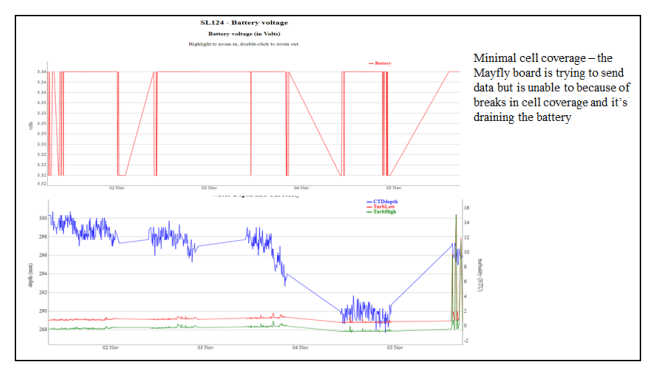
In certain scenarios where sunlight is restricted or diminished due to canopy coverage, cloudy days, or seasonality, battery level may decline over multiple days due to inadequate solar exposure and incomplete charging (see Data Patterns in the appendix). This gradual decline may also happen when cell coverage is intermittent, in which case the Mayfly Data Logger may make repeated and long unsuccessful attempts to send data to the website using extra power each time (see Data Patterns in the appendix).
In some cases, solar charging may vary throughout the year with seasonal canopy cover changes as well as other canopy cover changes (e.g., fallen trees, growth of vegetation). Reposition the solar panel direction to receive better sun exposure depending on the time of year.
Basic rule of thumb to follow when monitoring your online battery voltage:
- 4.0V-4.2V: fully charged battery.
- 3.7V-3.9V: sufficiently charged battery.
- 3.7V is the nominal voltage (Nominal voltage is the default, resting voltage of a battery pack). The middle ground between fully charged and the low voltage cutoff.
- 3.55V-3.7V: start to keep an eye on the battery pattern.
- 3.5V or below: if it stays at or below 3.5V for an extended period of time you may want to replace your battery. If you see that your station has dropped offline and your battery is below 3.5V, your battery died and needs to be charged or replaced.
See Battery Level as a Diagnostic in the appendix for more examples.
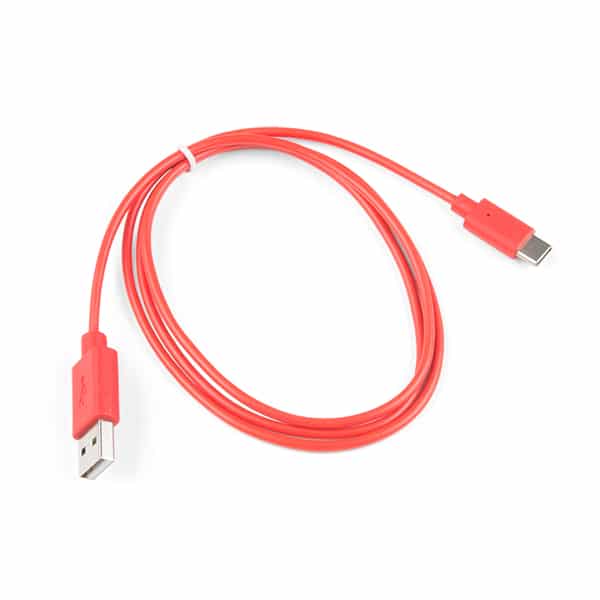
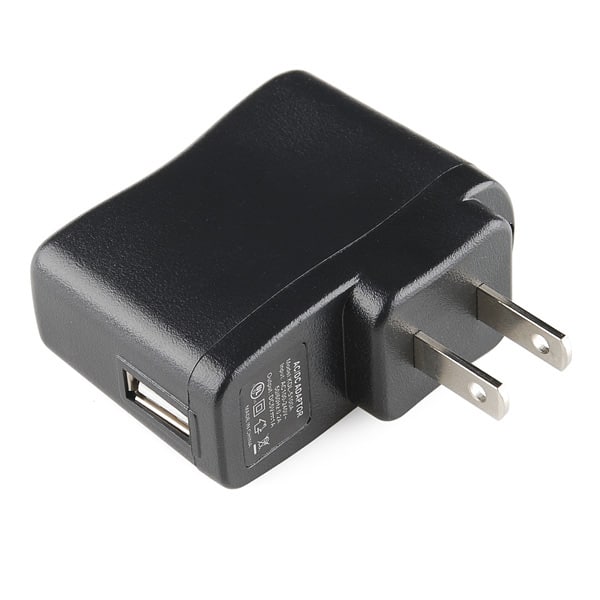
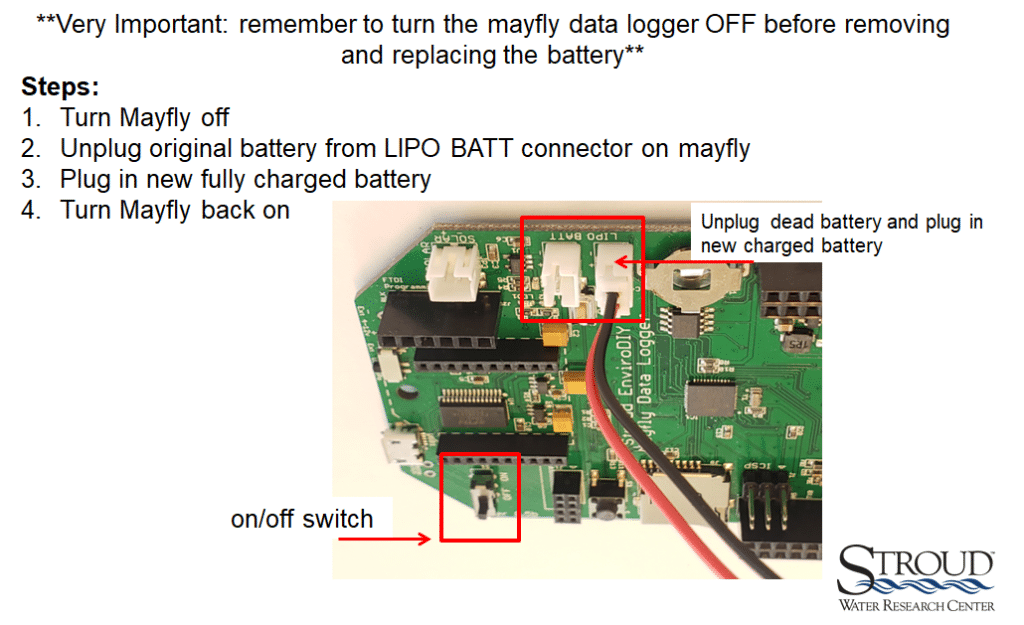
In cases where solar charging is not adequate for keeping the battery above 3.7 V, it may be necessary to assist in powering the stations by swapping out the dead battery with a second fully charged replacement battery. For this, purchase a backup battery, LiPo battery charger, USB charging cable, and USB Wall Charger setup to be able to charge your backup battery whenever required for your particular situation.
Do not buy random battery packs or battery chargers on Amazon or from other vendors without checking with the EnviroDIY forum first, the majority of LiPo batteries made for radio controlled cars/aircraft have backwards polarity wires on the connectors, which will permanently damage the Mayfly Logger if you connect them and could become a potential fire hazard.
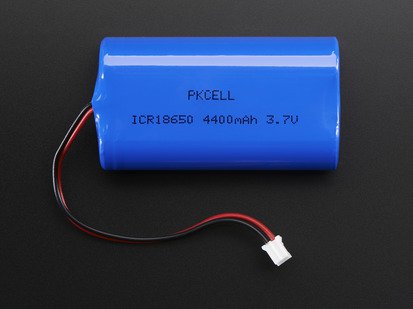
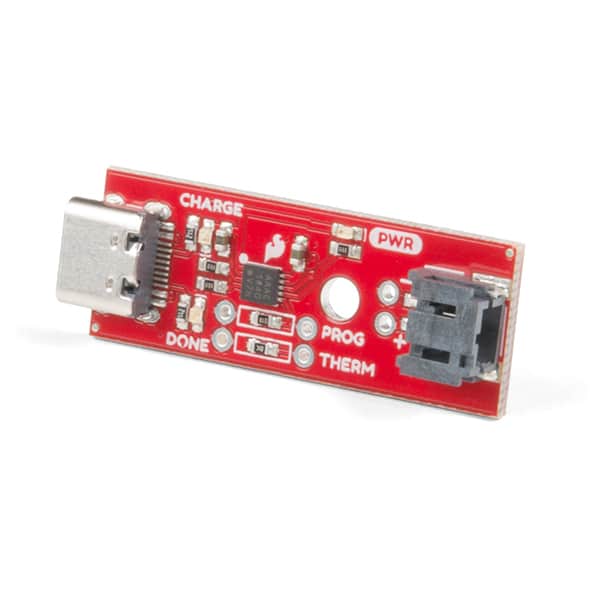
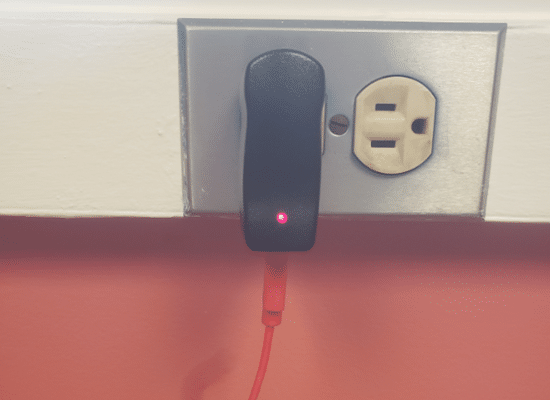
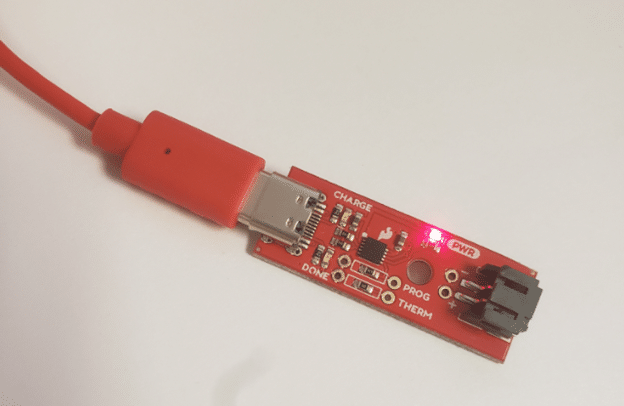
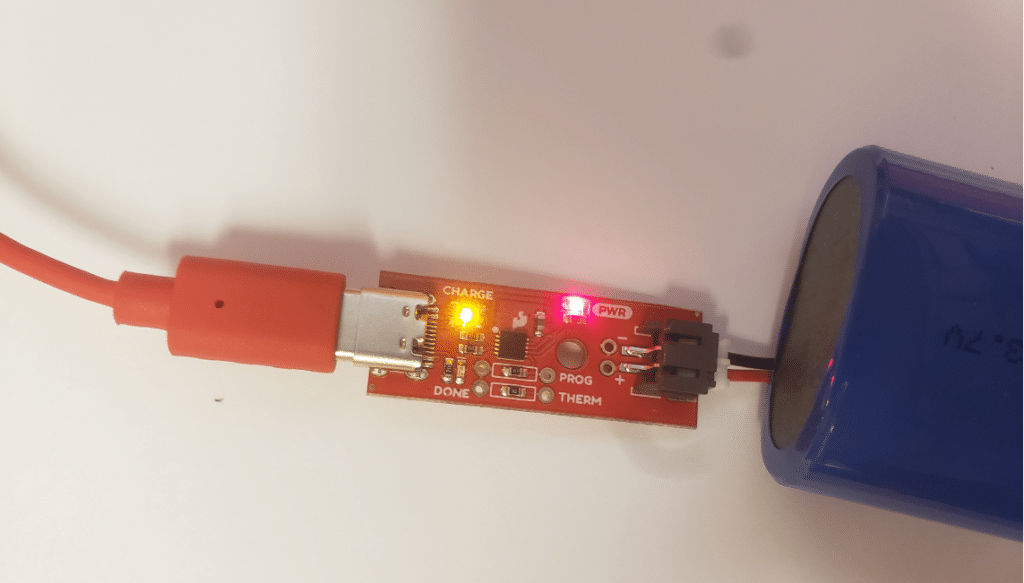
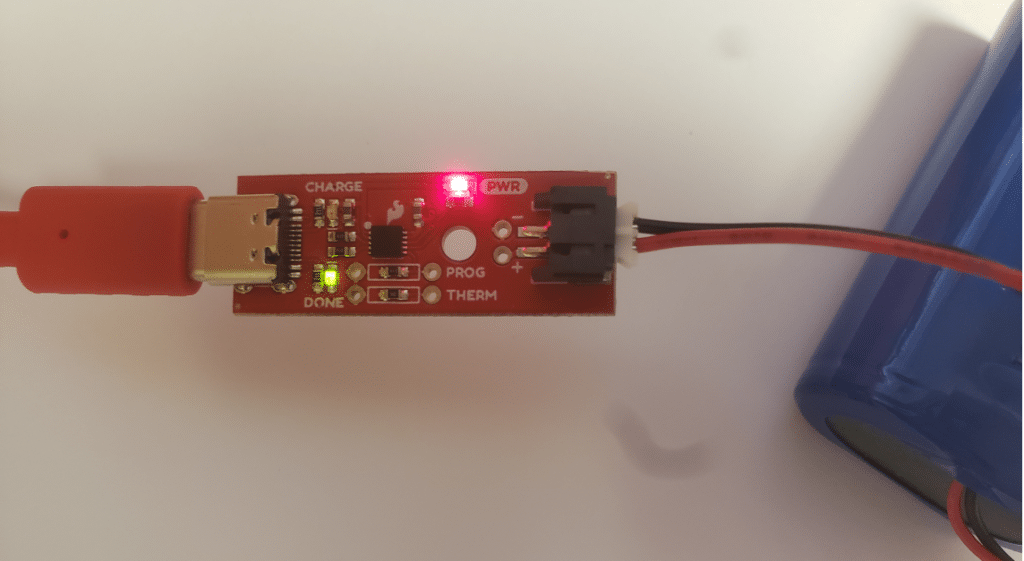
To ensure safety, be sure to only charge a battery while you are there to watch it. Keep the red charging circuit board away from any metal surfaces or liquids. Remove the battery from the charger as soon as possible after the green “done” light turns on.
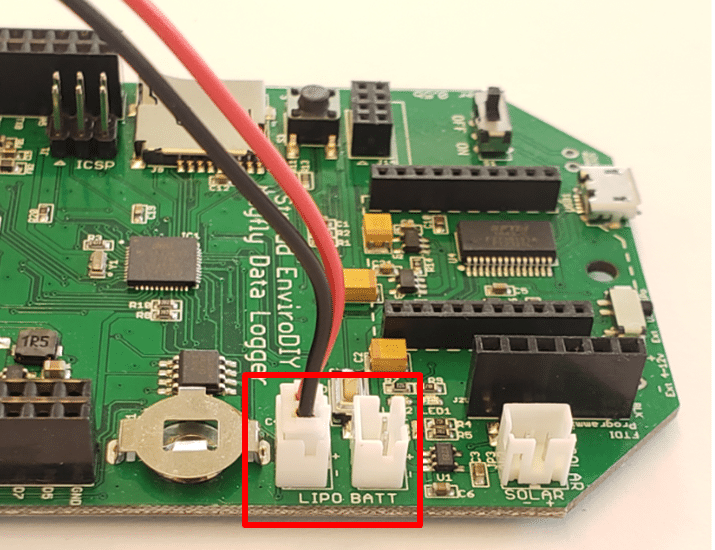
The LiPo battery plugs into the Mayfly Data Logger in either one of the two JST connectors labeled LIPO BATT (Figure 8.2.6.2), but only connect ONE battery to the Mayfly at a time, and never connect two batteries at the same time (the spare jack is for connecting a jumper cable for supplying battery power to auxiliary devices in rare cases.
The battery will only fit in one direction and should not be forced to go the opposite way.
You can verify the polarity by checking that the black wire is in line with the (-) sign and the red wire is in line with the (+) sign printed next to the white JST jacks. If the battery is forced in backwards, it could damage the mayfly and/or the battery.
When replacing the LiPo battery follow the steps listed below in Figure 8.2.6.3. Be sure to turn off the Mayfly using the main power switch before swapping batteries. Unplug the dead battery, connect the charged battery, and then turn the Mayfly back on with the main power switch. You should see the initial red-green LED blink pattern as the board starts up and is initialized.
8.2.7 Staff Gauge
The staff gauge is intended to serve as the master reference for stream depth at the EnviroDIY Monitoring Station location. The staff gauge will almost always measure a different depth than the CTD sensor simply because they are positioned at different locations in the stream.
For general reference and to confirm sensor or staff gauge data consistency, it is important to know the offset between the staff gauge and the sensor depth, i.e., the difference is between the water level as measured by the staff gauge and the water level as measured by the CTD sensor. This offset between staff gauge water depth and sensor water depth is also a key piece of information for use in developing the hydrologic (depth/discharge) rating curve.
Staff gauges installed in association with EnviroDIY Monitoring Stations are currently considered to be semi-permanent. They are set in the stream on ½” pipes which are generally stable and resilient; however, high flows in larger streams and rivers can damage the gauge by bending or breaking the pipe on which the gauge is mounted. If a staff gauge is bent or damaged it should be reset or replaced to the exact same depth using the the sensor/staff offset as the reference point.
View a guided video tutorial on how to build and install a staff gauge.
8.3 Data Patterns and Troubleshooting
Please see below for detailed information on data patterns and troubleshooting or consult the data patterns quick guides:
8.3.1 Example Data
8.3.2 Data Patterns
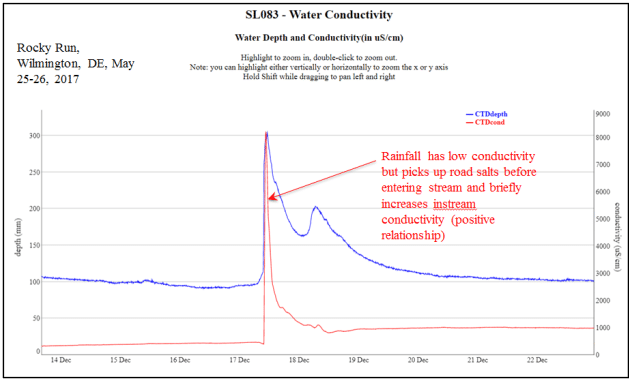
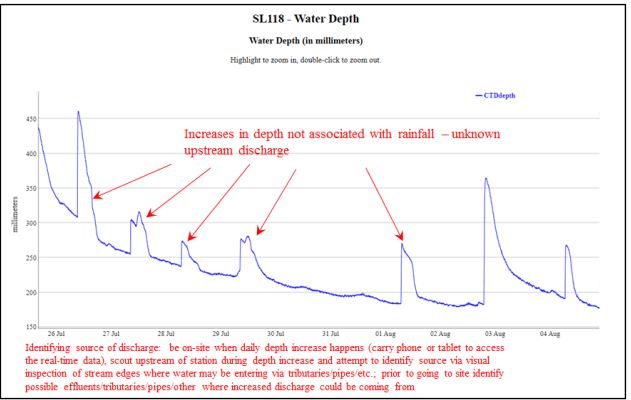
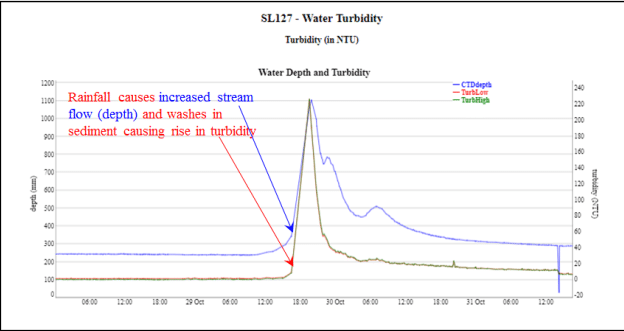
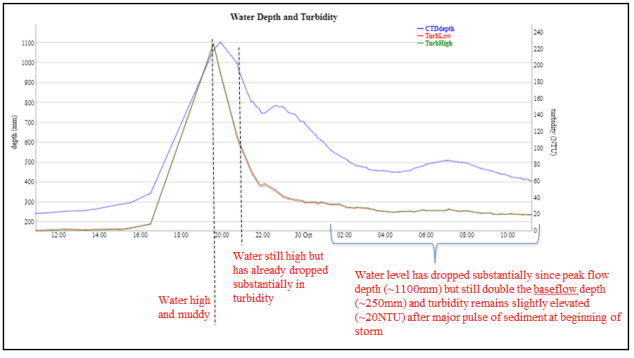
Ecological Data Patterns
Sensor Fouling Data Patterns
Battery Level as a Diagnostic
8.3.3 Troubleshooting
The EnviroDIY Monitoring Station Troubleshooting Quick Guide is designed to be printed to provide troubleshooting tips while in the field. Further explanations can be found in Appendix 4: Troubleshooting.