The monitoring objectives and research goals should be the main consideration when preparing for the installation of an EnviroDIY Monitoring Station. The parameters to be measured, frequency and timing of measurements, monitoring station location, and placement of sensors within the stream all affect the data that will be collected. That data must appropriately characterize the environmental condition that is necessary to successfully answer a research question or achieve a monitoring goal.
Step-by-step instructions for installing an EnviroDIY Monitoring Station can be found in the EnviroDIY Monitoring Station Tutorials video playlist.
7.1 Installation Equipment
View the EnviroDIY Monitoring Station Parts List
Equipment needed for installing the monitoring station and sensor bundle includes:
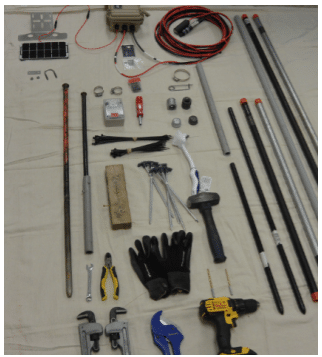
- Hammer
- 2 x 4 wood block (to hammer on)
- Wire cutters
- 7/16” wrench
- Power drill
- 5/32” drill bit
- 3/16” drill bit
- Two pipe wrenches
- PVC pipe cutter
- Black rebar spray painted orange: used to hammer a pilot hole in the stream bed and on the stream bank, avoid damage to the rebar and pipe.
- Tent stakes
- Gloves
- Extension rod for hammering the in-stream rebar in deep water where the rebar goes underneath the water (black rebar with PVC pipe attached).
- Nut driver (or screwdriver) that accommodates hose clamps
7.2 Choosing an Installation Location
7.2.1 Cellular Signal
Cellular signal can be variable and is subject to change during storm events and seasonal changes. Factors such as cloud cover and vegetation cover can affect the cellular signal in some cases. Cellular signal is also subject to change due to issues with the cellular network itself (i.e. temporary cellular network outages). Stroud Water Research Center uses a device, created by electrical engineer Shannon Hicks, to detect the strength of the cellular signal.
In the absence of signal detector, take your station out to the proposed installation location, turn it on, and see if data are easily transmitted to Monitor My Watershed on regular five-minute intervals before installing the station. If data do not appear in the online portal, search for a different location. A disadvantage of this signal testing method is that the test data collected while testing for cellular signal will be sent to Monitor My Watershed and and cannot be deleted. Test data points should be documented in an official Field Visit Data Form so they are not confused with subsequent stream measurements.
If there is not enough cellular signal in the location that needs to be monitored, the EnviroDIY Monitoring Station can be used at that site but will need to be manually uploaded (see Programming and Activating an EnviroDIY Monitoring Station: Registering a Station on MonitorMyWatershed.org).
7.2.2 Sunlight Availability
The monitoring stations use a solar panel to recharge the lithium ion polymer battery. It is important for solar panels to be positioned so that adequate sunlight is received throughout the day. Vegetation can be cleared to help with sunlight exposure (Figure 7.2.1). However, keep in mind that as the seasons change, vegetation will grow back and can cover the solar/col panel (Figure 7.2.2).
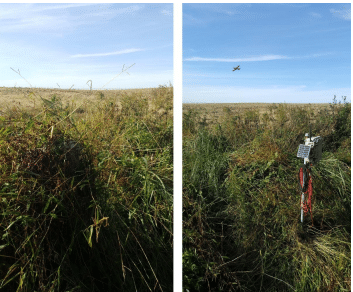
It is also crucial to pay attention to the direction the solar panel is facing. Generally, in the northeastern U.S. a solar panel will receive the most sunlight if it is facing south (Figure 7.2.3). At times, solar panel orientation can be more important than the size of the panel. If the solar panel is facing in a direction that receives little sunlight, even with a large solar panel charging may be inadequate. The best position of a solar panel will vary depending on each specific station location. Heavy canopy cover, for instance, may dictate that the solar panel needs to be faced toward breaks in the canopy cover. Positioning a solar panel in a north orientation will rarely occur because it will receive substantially less direct sunlight. As the angle of the sun changes throughout the seasons it may be necessary to adjust the solar panel to obtain optimal sunlight.

7.2.3 River and Stream Morphological Features
Ideally, monitoring stations are placed on straight and even flow sections of streams where debris will not accumulate on the sensors and where discharge measurements can be made for use in association with sensor data for developing rating curves. Placement within the stream channel should take into consideration stormwater flows and whether these flows will be detrimental to the sensor stability and exposure to scouring forces and movement of bedload. To this end, if storm flows are anticipated to be potentially damaging to sensors it may be necessary to position sensors in backwater areas, stream bends, or behind obstructions (e.g., boulders, abutments) that would provide protection from extreme stormwater flows.
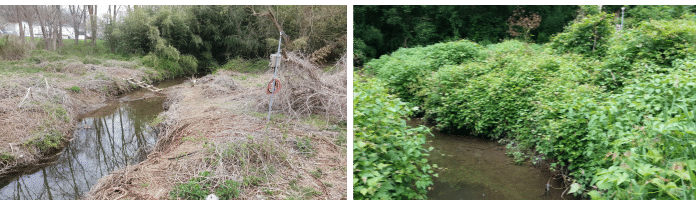
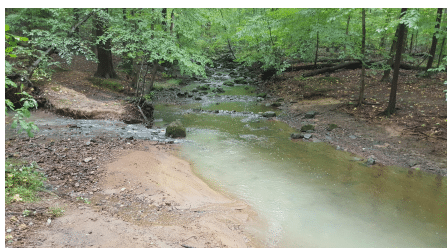
Considering stream morphology, flow, and other physical characteristics when identifying monitoring station installation locations is important for ensuring the collection of data suitable for satisfying project goals. Lateral (cross-channel) mixing may require a long distance of stream channel, so do not measure immediately downstream of tributaries or point sources that may not represent the mainstem of the channel (Figure 7.2.4). Turbulent streamflow may aid in mixing, but turbulence can create problems in monitoring field parameters, such as DO or turbidity. A location near the streambank may be more representative of local runoff or affected by point-source discharges upstream, whereas a location in the channel center may be more representative of areas farther upstream in the drainage basin. Large streams and rivers usually are monitored from the downstream side of bridge abutments, assuming that safety hazards and other difficulties can be reduced or overcome.
Cross-section variability and upstream influences are major factors for site selection. Cross-section surveys of field parameters must be made to determine the most representative location for monitor placement. Sufficient measurements must be made at the cross section to determine the degree of mixing at the prospective site under different flow conditions and to verify that cross-section variability at the site does not exceed that needed to meet data-quality objectives. Additional cross-section measurements must be made after equipment installation to ensure that the monitoring station installation is representative of the stream during all seasons and hydrographic flow conditions (Wagner et al., 2006).
The best location for a monitoring site is often one that is best for measuring surface-water discharge. Although hydraulic factors in site location must be considered, it is more important to consider factors that affect water quality conditions. The same hydraulic factors that must be considered when selecting a specific site for measuring discharge in a channel also should be considered in selecting a water-quality monitoring location. Both purposes require a representative site that approaches uniform conditions across the entire width of the stream (in contrast with the condition shown in Figure 7.2.4).
The measurement point in the vertical dimension also needs to be appropriate for the primary purpose of the monitoring installation. The vertical measurement point can be chosen for low-, base-, or high-flow conditions; if bed movement or sensor location during low flow is a problem, consideration should be given to moving the sensors along a bridge. For a medium to small stream with alternating pools and riffles, the best flow and mixing occurs in the riffle portion of the stream; however, if flooding changes the locations of shoals upstream of the monitoring site, the measurement point may no longer represent the overall water-quality characteristics of the water body. Streams subject to substantial bed movement can result in the sensors being lost or located out of water following a major streamflow event, or at a point no longer representative of the flow. A site may be ideal for monitoring high flow but not satisfactory during low flows.
The configuration and placement of water-quality monitoring sensors in cold regions require additional considerations in order to obtain data during periods of ice formation. Overall, a monitoring site should be safe and accessible, meet minimum depth requirements of the equipment, minimize the risk of vandalism, and be characteristic of the entire stream. It may be necessary to reconnoiter the site under several flow conditions before a determination is made.
7.2.4 Bank Conditions
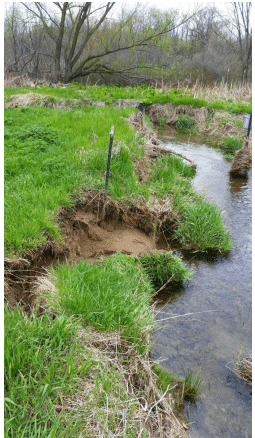
When positioning logger stations on the stream bank, the stability and erosion potential of banks should be considered. Abstain from installing a station near areas on the stream bank that seem to be undercut. If a station is installed on an erosional surface, it is likely that the station will not survive long term.
The galvanized pipe that is used to mount the data logger box should be at a sufficient depth to withstand flood conditions without becoming dislodged: marshy areas with soft sediment will require at least 4’ of pipe installed into the ground, whereas rockier locations may only need 30-36” installed into the ground). If a location has sediment that is very sandy or has a lot of gravel, be aware that your pipe underground needs to be installed at a depth where the pipe will not rotate or spin loosely in the hole. If you try to spin or wiggle the pipe, it should hardly move. If the pipe continues to move, you will need to drive the pipe deeper into the ground until it no longer moves.
7.2.5 Bed Composition
The composition of the stream bed can determine what station parts are able to be used, particularly in regards to the in-stream sensor bundle. For example, if the bed composition is extremely rocky, or near bedrock, a shorter 2’ rebar will need to be used. If the stream bed is extremely soft (e.g., loose sand or mud) it maybe be necessary to use a longer rebar or other stake to ensure the sensors are stable within the channel. For this type of custom installation consult the EnviroDIY forums.
7.2.6 Distance from Sensors to Logger
For ease of access in conducting maintenance, the sensor bundle should be placed at a location out of the main flow path, near the stream bank, where the water is at least 30 cm but no more than one meter in deep. Sensor wires should never run across the stream bottom from one bank to another because this greatly increases the probability of damage to the sensor in high flow conditions. Always mount the sensor bundle near the same bank where the logger box is mounted. The OBS-3+ turbidity sensor needs at least 30 cm of water depth due to obtain good readings. The sensor wires are about five meters in length, however extension cables can be purchased if the location of the data logger box needs to be father than five meters for any reason. Historical hydrographs and first-hand observations describing overbank flooding should also be considered when positioning logger stations on the bank. Data logger boxes should be positioned well above any expected flood levels. In the event that a logger does become submerged, the waterproof casing will keep it protected.
7.3 Installation Steps
View the EnviroDIY Monitoring Station Parts List
Step-by-step videos are available on the Videos page.
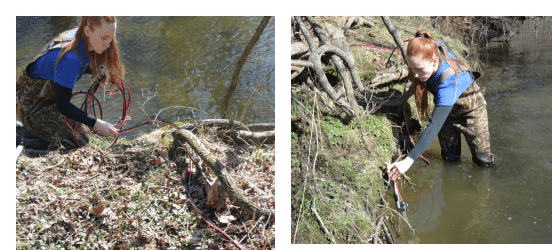
7.3.1 Locate Spot to Deploy Sensors
- Find location of monitoring station in the stream.
- Keep in mind the flow pattern of the stream, the water depth, and take note of any built up debris from past storms and be sure to avoid these areas.
- When choosing a location for the sensors, keep in mind that there also needs to be a suitable location for the logger box on land within 15’.
- Hammer the test post into the stream bed to find a secure, stable spot.
- Set the anchor pole (solid steel rebar with a pointed end that will be the attachment point for the sensor bundle).
- This rebar is driven into the stream bottom using a hammer and a wood block to prevent damage to the top of the post.
- The length of the rebar should be driven far enough into the stream bottom to ensure that the sensor bundle and anchor pole will not move during flood events and does not twist within the substrate of the stream bottom.
- The rebar should be hammered so that the top of the rebar is flush with the water surface to minimize accumulation of debris on the sensor bundle.
- Additionally, the anchor pole should not be driven so deep into the stream bed that it cannot be removed when the study is complete or in response to changes in the site requiring station repositioning.
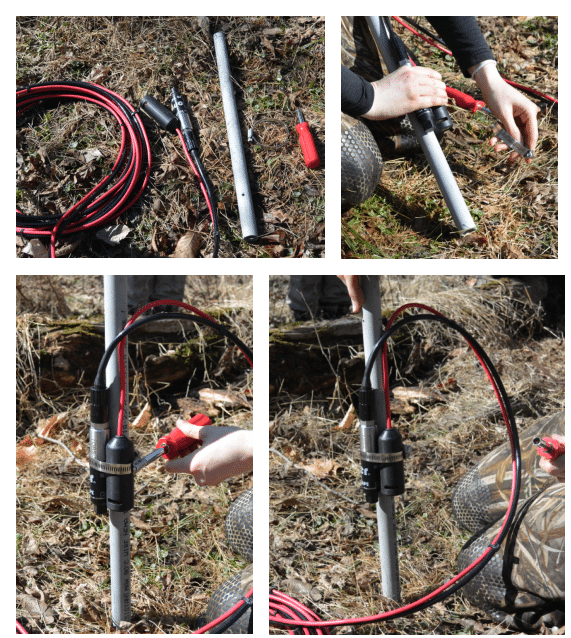
7.3.2 Prepare to Install the Logger Box
- Find a location on the stream bank for station post/box with good sun exposure.
- Clear the area on the bank where the data logger station will be positioned by removing vegetation that may block sunlight to solar panels or that may cause problems during floods.
- Alternatively, if vandalism is a concern, leave some vegetation around the station to help camouflage the station.
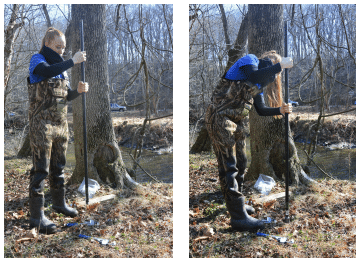
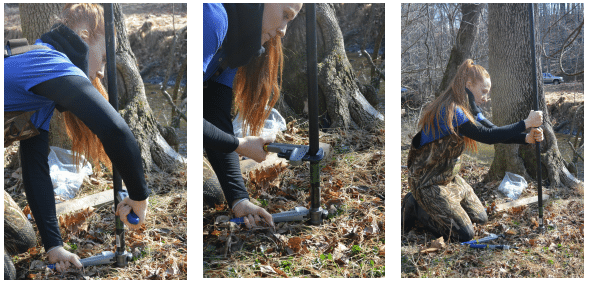
- Two sections of ¾” diameter pipe are used to create the data logger mounting pole: a shorter length (typically 36” long) that will be hammered into the ground and a longer length (typically 60” long) that will mount the logger box above ground on the stream bank.
- Pound in a stake to create a pilot hole, then attach the ¾” coupler to the shorter pipe and hammer the pipe into the ground (place a 2 x 4 wood block on top of the coupling to prevent damage to the threads).
- Stop hammering the shorter pipe into the ground with a few inches between the ground surface and the coupler.
- Tighten the coupler onto the short pipe using pipe wrenches.
- Twist the longer pipe onto the coupler and tighten again using pipe wrenches; note that pipe lengths vary based on the specific needs of each station location.

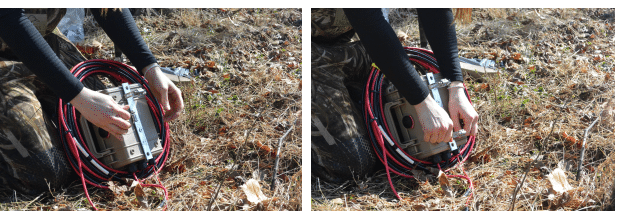
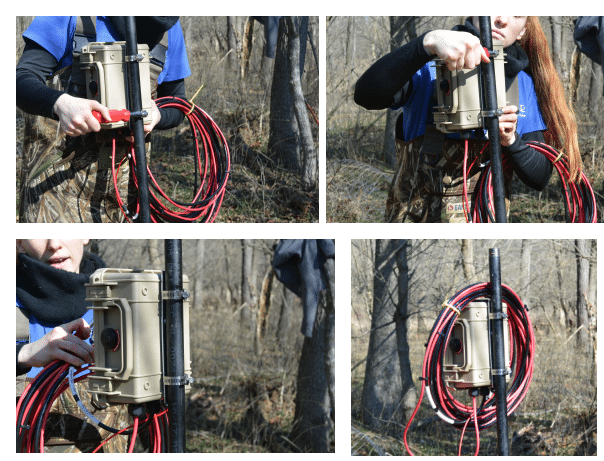
7.3.3 Assemble Logger Box on Pole
- Attach data logger box to pole by 1) sliding two stainless steel hose clamps (⅞” to 1 ½” size) through the gap between the back of the logger box and mending plate, 2) tightening hose clamps around pole.
- To make it easier to secure, place the nuts of both hose clamps on the same side.
- Determine how high the data logger box should be on the pole by considering who will need to access this station: if children will need to access the station, place the logger box at eye level of the children, alternatively, if the volunteers are taller, place the logger box at a height that will be suitable for all needing access.
- Consider where the high flow marks are in the area and look for woody debris and other markers such as garbage to get an idea of how high the water usually gets during high flow events; place the logger box above these to prevent it from being submerged.
- Start with the bottom hose clamp; tighten it a bit, then do a final tighten at the end when solar panel is added.
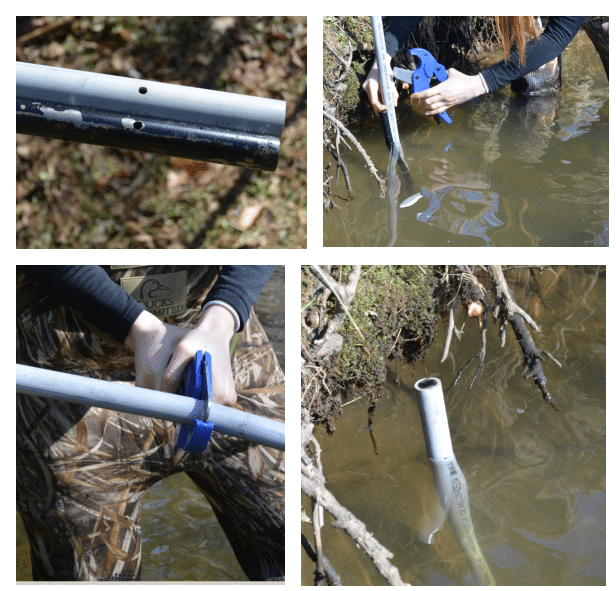
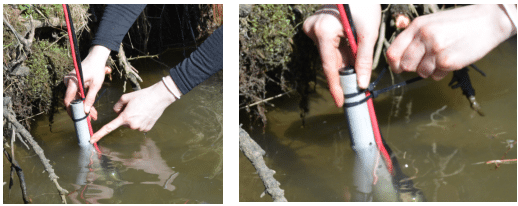
7.3.4 Prepare the Sensor Bundle
- Cut the ¾” PVC pipe to the appropriate length.
- Use the lettering that exists on the PVC pipe as a way to accurately measure the top of the black rebar with holes.
- Measure height of PVC where it lines up with the top of the rebar.
- NOTE: always cut at height of rebar, not the stream surface line.
- Do the final cut of PVC using the pipe cutters and fit on rebar to check and make sure the cut lines up properly. If the cut was done properly the top of the PVC pipe will be flush with the top of the rebar.
7.3.5 Attach Sensor Bundle to PVC
- Unwind the sensor cables at the data logger box.
- Attach sensors to PVC using the larger hose clamp and the nut driver or screw driver. Things to note:
- The sensors need to be a certain height from bottom (about 3” if possible); this is site specific and depends on the amount of sediment and rocks on the stream bottom.
- The turbidity sensor needs to be facing into the stream channel not towards the stream bank. The four metal screws within the CTD sensor should be facing upstream so that fresh water is continually hitting it.
- The hose clamp should be tightened over electrical tape around the turbidity sensor to provide extra protection, and also above center/middle of CTD sensor to avoid damage to the pressure transducer.
- Tighten to the extent that sensors don’t move up/down, but not tight enough to cause damage to the sensors.
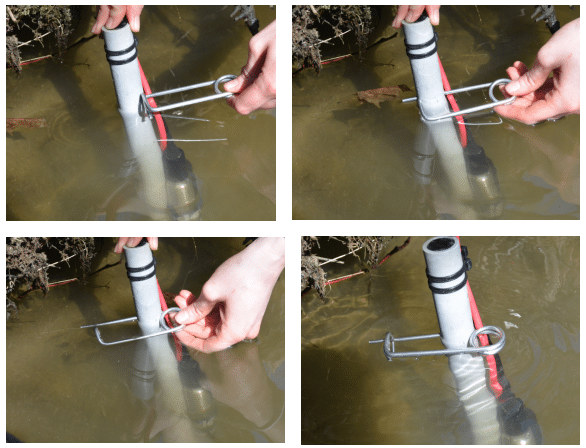
7.3.6 Attach Sensor Bundle to Rebar
- Place sensor cables from sensor box (on land) to the rebar mounted in stream.
- Consider bank stability and debris pile ups.
- Lay out all cables first, then bundle what you don’t need at sensor box.
- Wrap cables under roots along the bank that are stable.
- Do not attach to vines or loose materials that will break during storm events.
- Secure the sensor bundle using the metal retaining pin.
- Line up holes of PVC and post.
- Insert pin from upstream side so clamping is on downstream side (to prevent debris from building up).
- In the stream: make sure angle of turbidity sensor is facing into channel and there are no obstructions within one foot.
- If window is facing the wrong way, the retention pin can be used as a handle to twist metal rebar until turbidity window is facing the correct direction.
- Work from the sensor bundle back to the data logger box when securing the cables using tent stakes and zip ties.
- Secure the sensor cables along bank keeping these things in mind:
- Use zip ties, tent stakes, hammer, and wire clippers.
- Use stable roots.
- Leave a little give between stakes (stabilization spots).
- Two zip ties might be needed if a root is wide.
- Zip tie tips:
- There are two sizes: 11” (long) and 8” (short).
- Don’t pull too tight in the cold as they are brittle and will break.
- Don’t crimp zip ties along sensor cables.
- Use black zip ties with UV protection for outdoor use, not white zip ties (these will break very quickly if being used outdoors).
- Cut zip ties at a perpendicular angle and as short as possible.
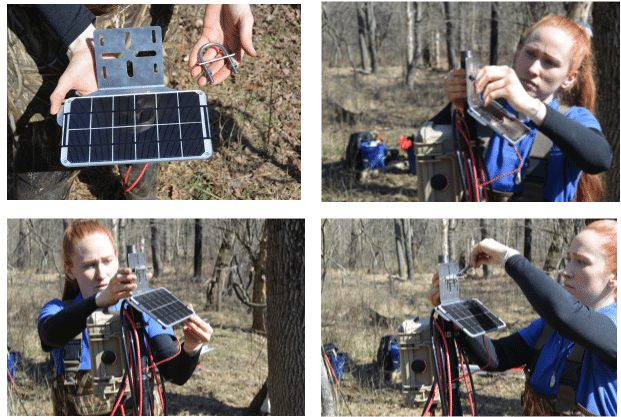
7.3.7 Attach Solar Panel to Post
- Add solar panel.
- Solar panel orientation should be facing south or west. Keep in mind obstructions to sunlight such as leaves, and account for this when choosing a direction for your solar panel.
- Adjust as necessary for height.
- Attach with U-bolt and tighten by hand first, then with wrench (7/16”); don’t tighten too much, as the plate is aluminum and may bend.
- Connect solar panel wire: there are two notches on side of wire connect to panel. Push wire from logger box all the way past notches (this makes it waterproof).
- Once connected, an orange light will appear on the Mayfly Data Logger inside of the logger box.
- This display will show whether or not the lithium ion polymer battery is being charged.
- If the LED light on the Mayfly Data Logger does not come on, this means that either the solar panel wire is not connected, or that the battery is fully charged.
- Secure solar panel wire with zip ties.
- Secure all wires and trim with cutters (making a horizontal cut as this makes the cut less sharp).
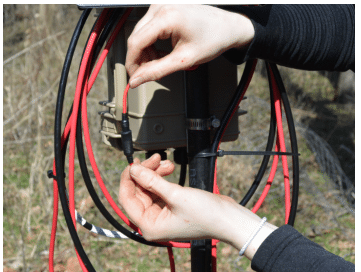
7.3.8 Attach Sensor Wires to Post
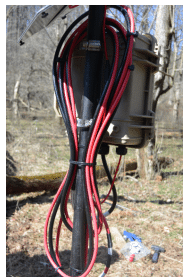
- Bring sensor cables to the logger box and loop them neatly around box.
- Secure the sensor cables with zip ties: do not pinch or crimp the CTD cable (particularly the white vented area of the cable) because this could damage the vented tube inside the cable and affect pressure (depth) measurements.
- Trim zip ties on the pole, but do not trim zip ties along wire length on the ground so you can find the wire if needed at a later time.
Figure 7.3.15. Neatly secure sensor wires around logger box.Figure 7.3.16. Trim zip ties along pipe.
7.3.9 Make Final Adjustments
- At the top of the monitoring station post, add a ¾” threaded pipe cap to keep out critters such as bees, ants, or spiders.
- Turn on monitoring station and check for functionality by looking at the light pattern as well as plugging in USB to Android phone to check sensor readings.
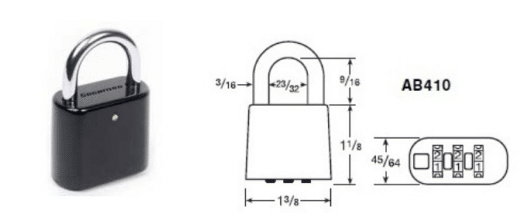
- Place lock on box.
- The specific size padlock that fits on the Pelican case of the EnviroDIY logger box is a AB410 CCL Sesamee Resettable Combination Padlock. Using a combination padlock, instead of a padlock with a key, is beneficial if the station is going to have multiple people maintaining the station and needing access to the logger box. The best location for locking the logger box is the bottom hole on the logger box door.
- A laminated sign, sticker, or business card should be attached to the logger box (Figure 8.23). Information on this signage should include at minimum contact information of the person/organization managing the station. Additional information may include descriptions of station function, monitoring goals, project descriptions, and educational intentions.

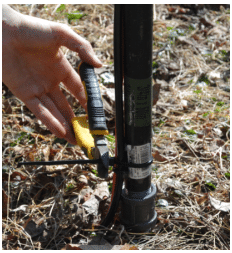
7.4 Staff Gauge and Stream Bottom Rebar
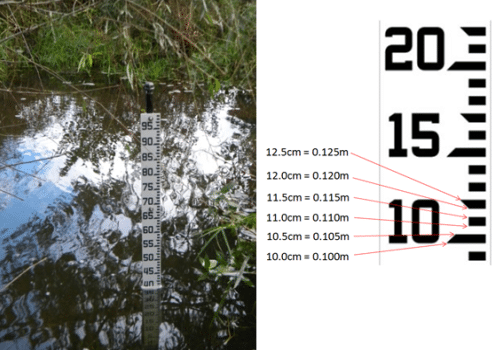
A staff gauge (Figure 7.4.1) is installed with the monitoring station to serve as a semi-permanent on-site depth reference that is used to develop hydrologic rating curves (see Supplemental Sampling, Rating Curves, Loads). The staff gauge is a “master reference” for depth over the lifetime of the monitoring station deployment. The staff-sensor depth offset is the difference between water level measured on the staff gauge and water depth measured by the CTD sensor. Once installed, any subsequent adjustments to positioning of the staff gauge will require adjustments to the rating curve (if developed).
Many different staff gauge models are available with different units and measurement increments. Staff gauges installed in association with the EnviroDIY monitoring stations are in metric units (cm) in half-centimeter increments (Figure 7.4.1).
View an video on how to install this staff gauge setup.
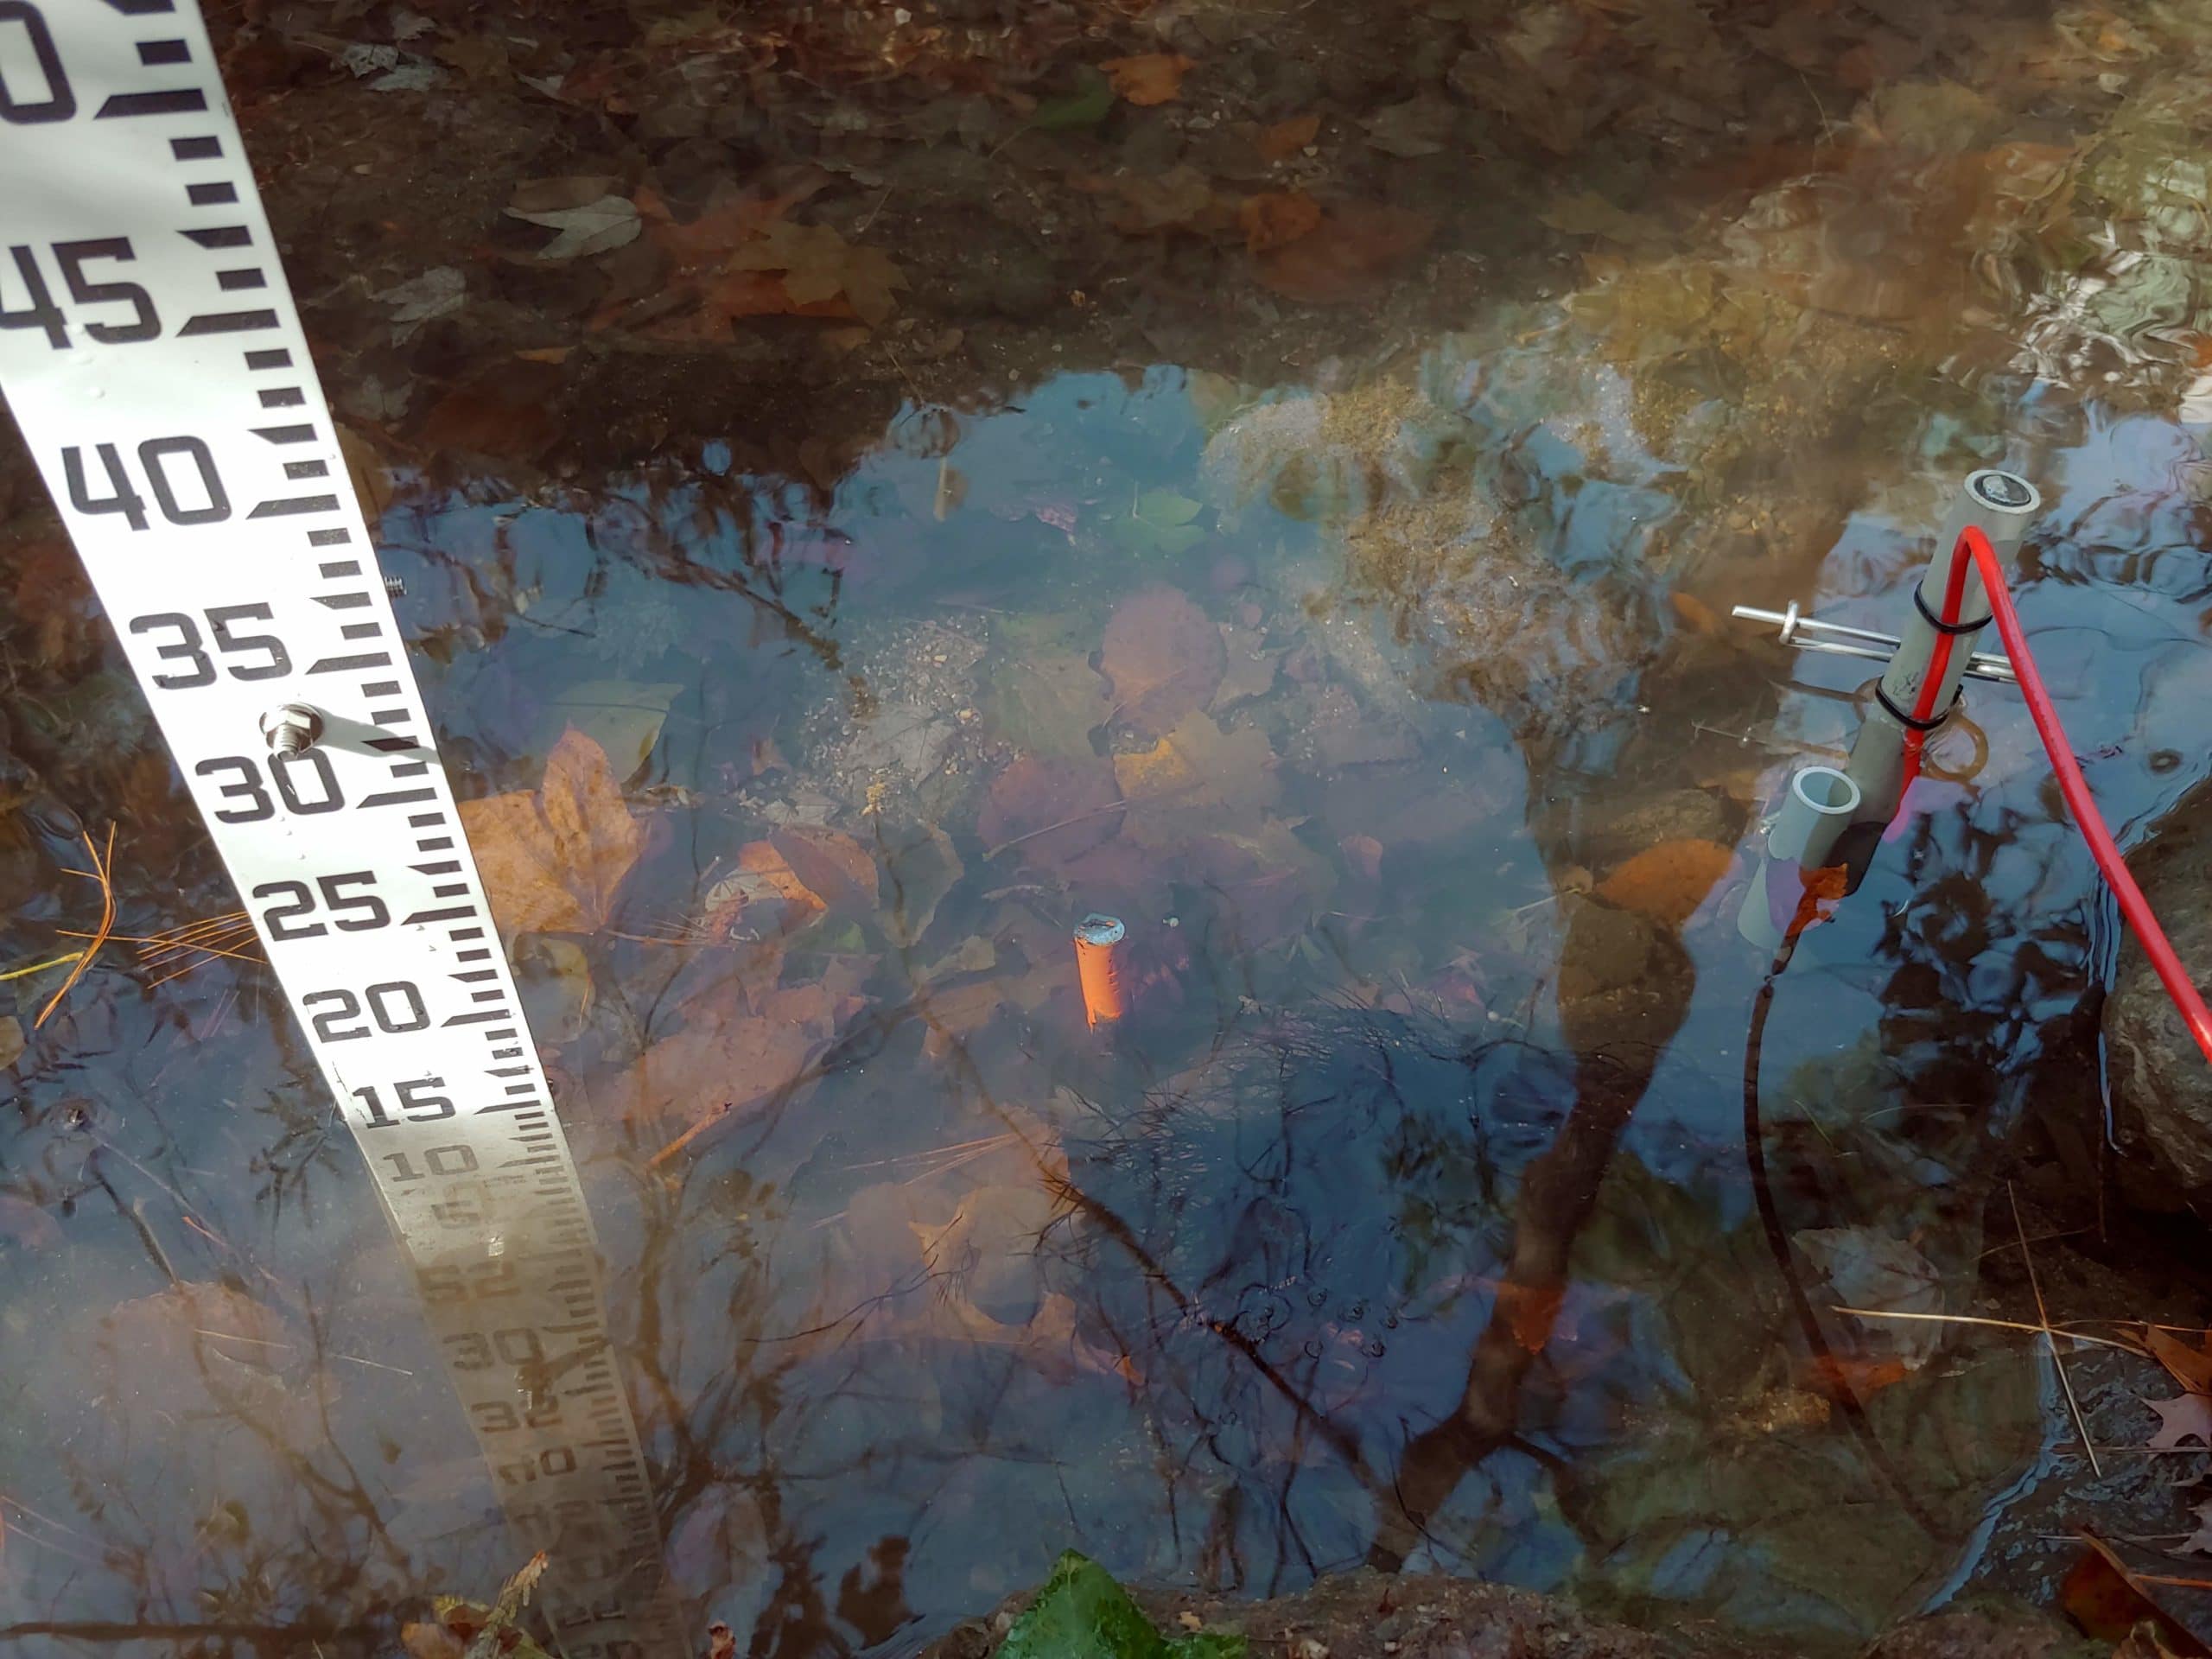
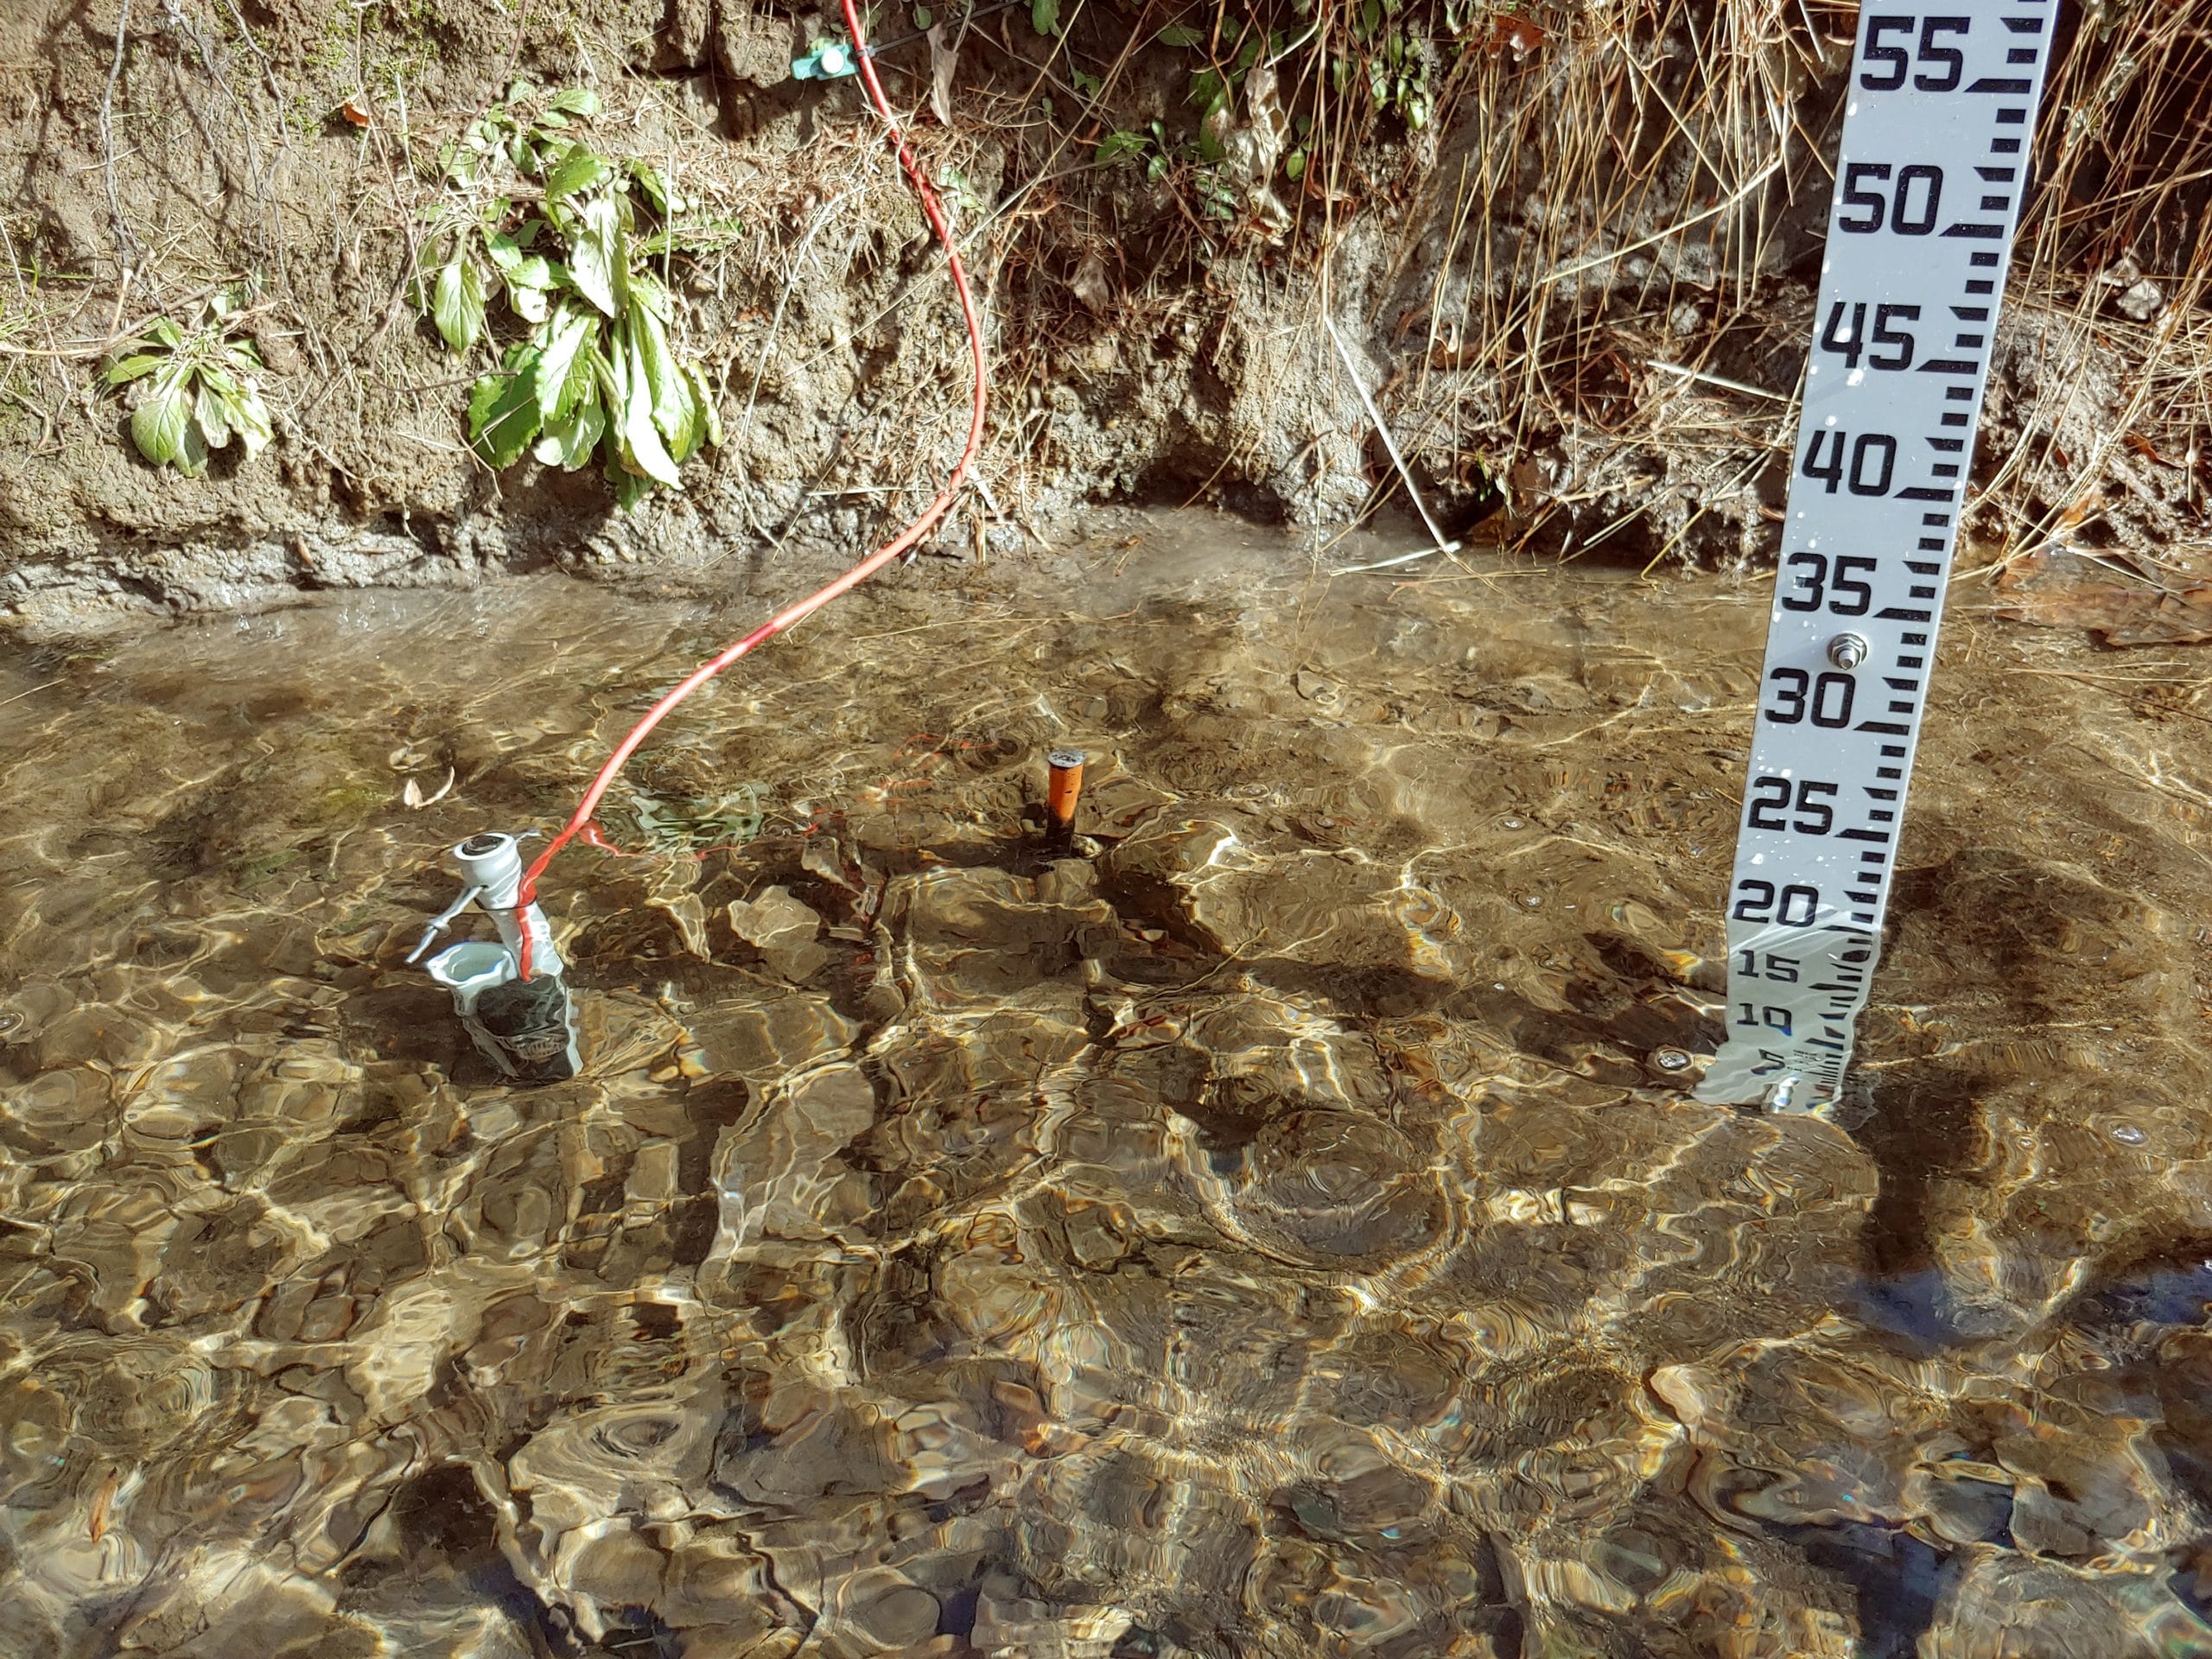
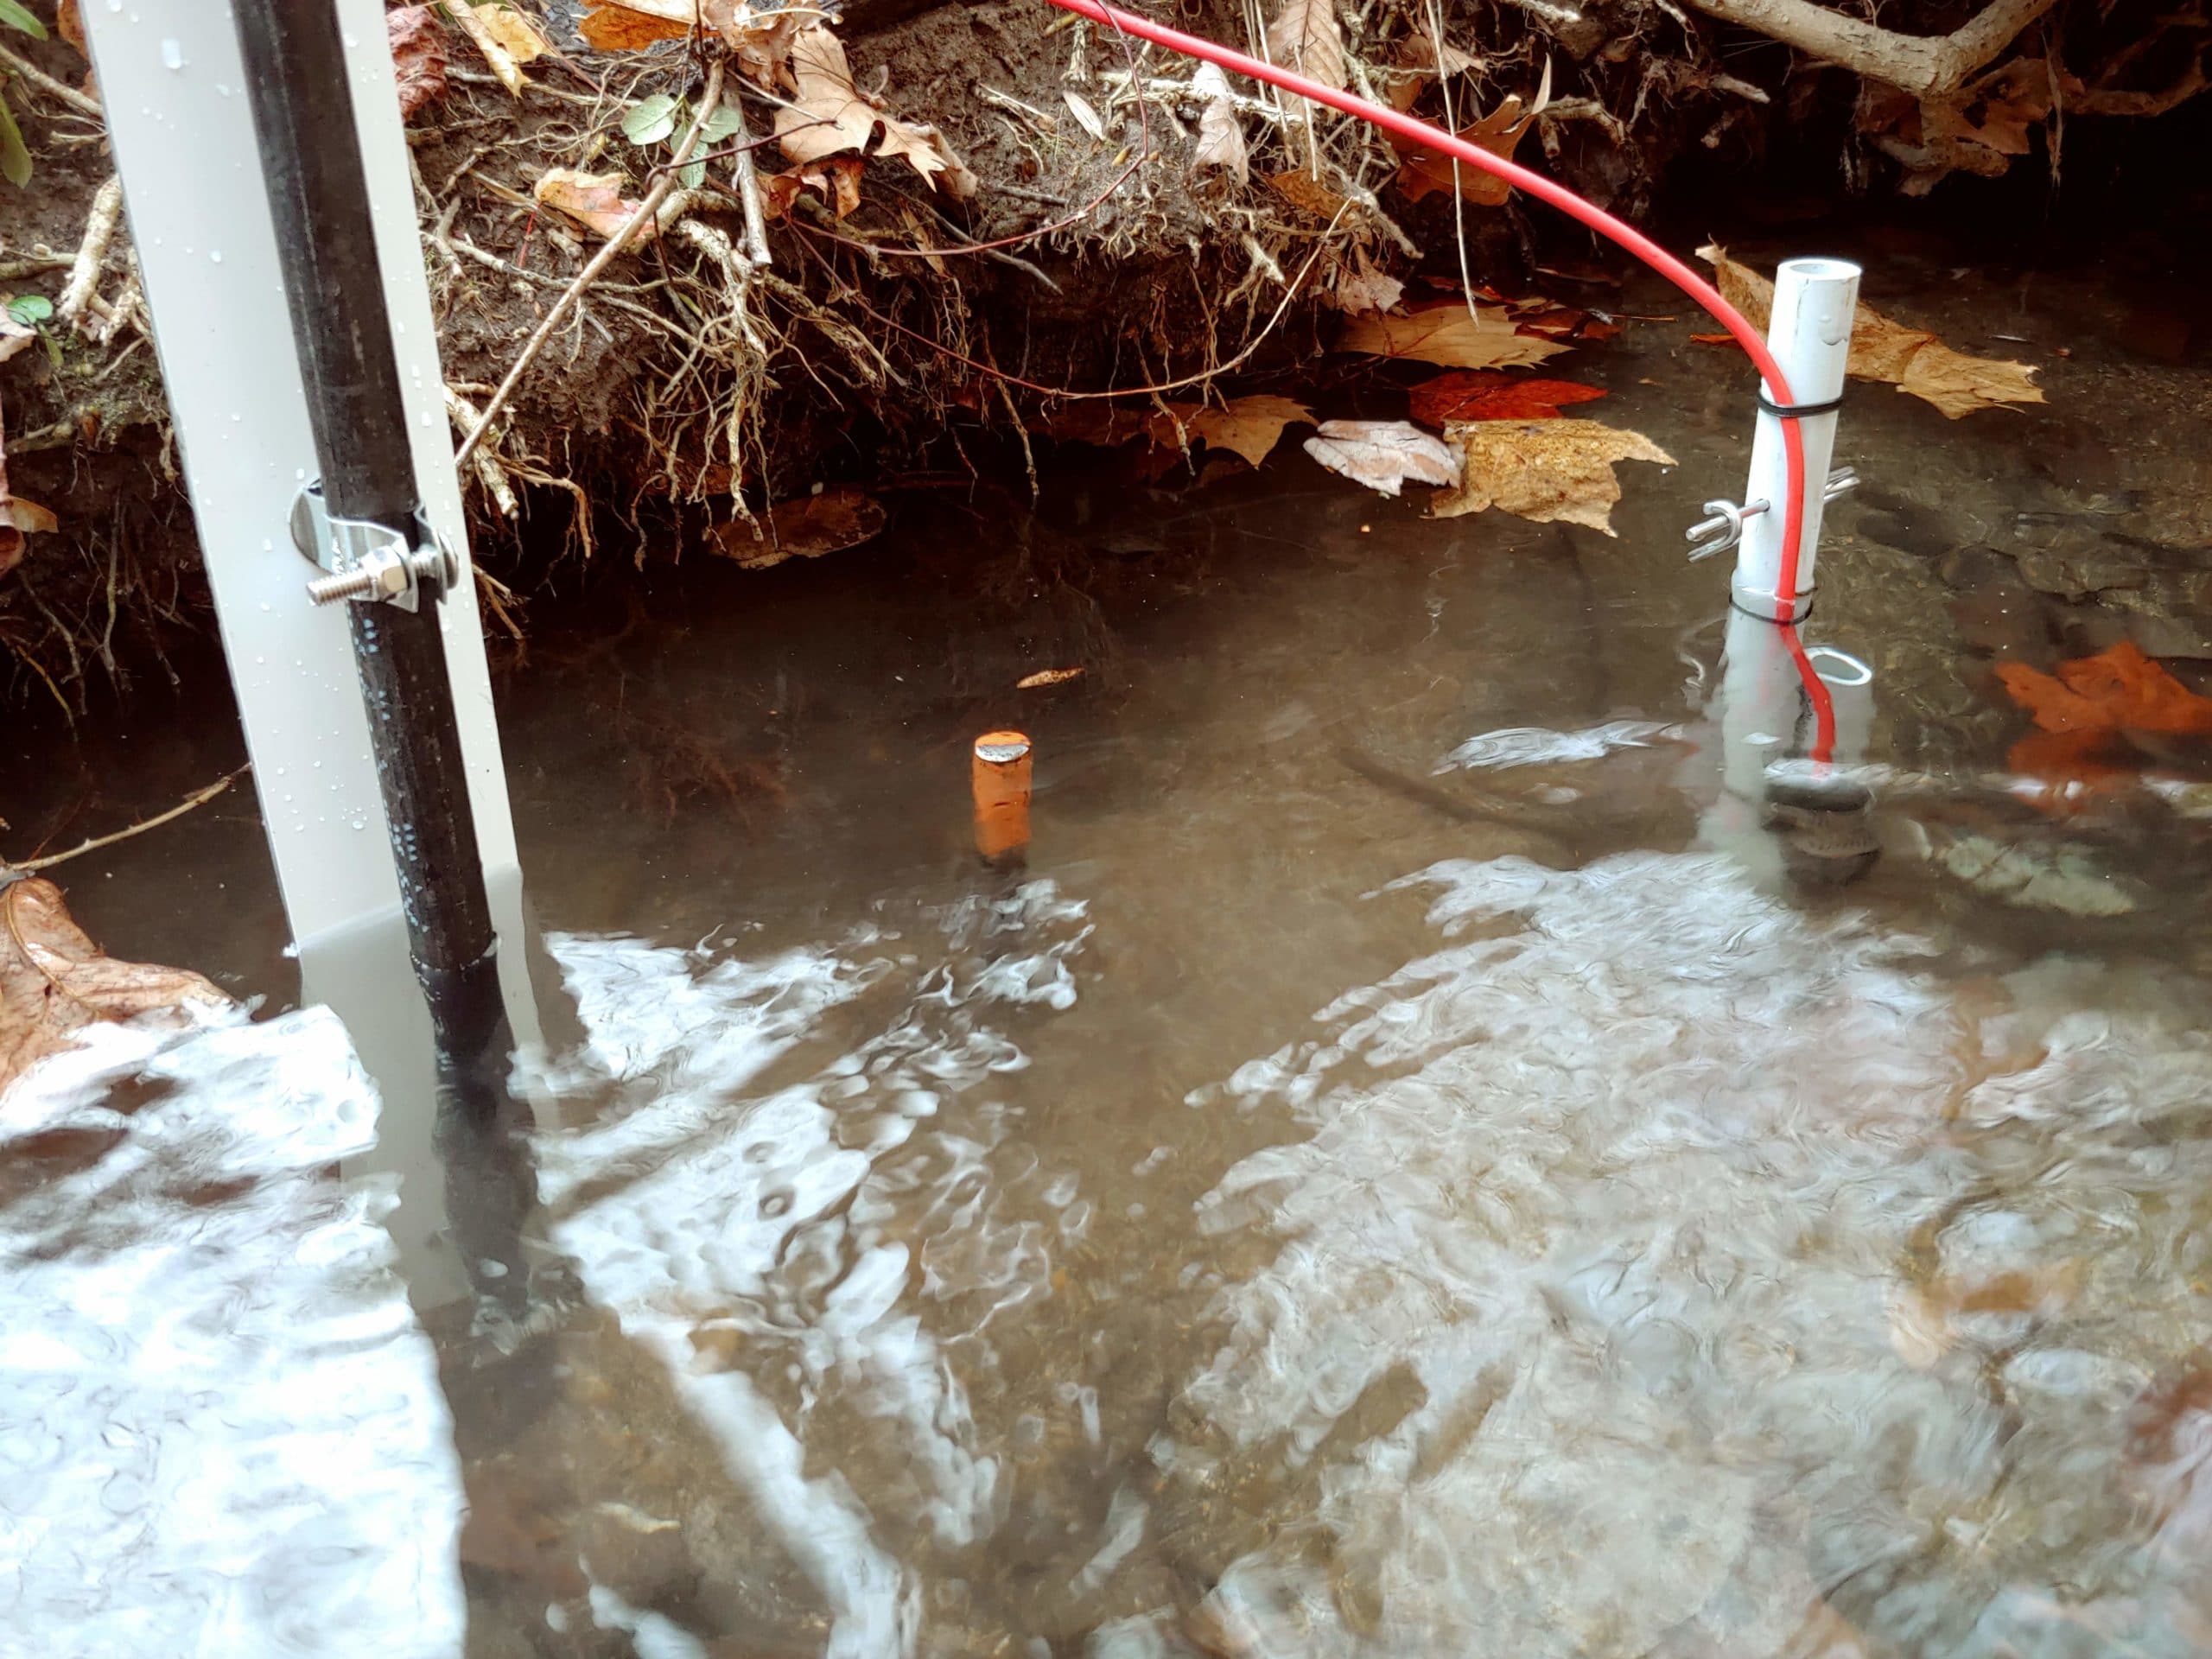
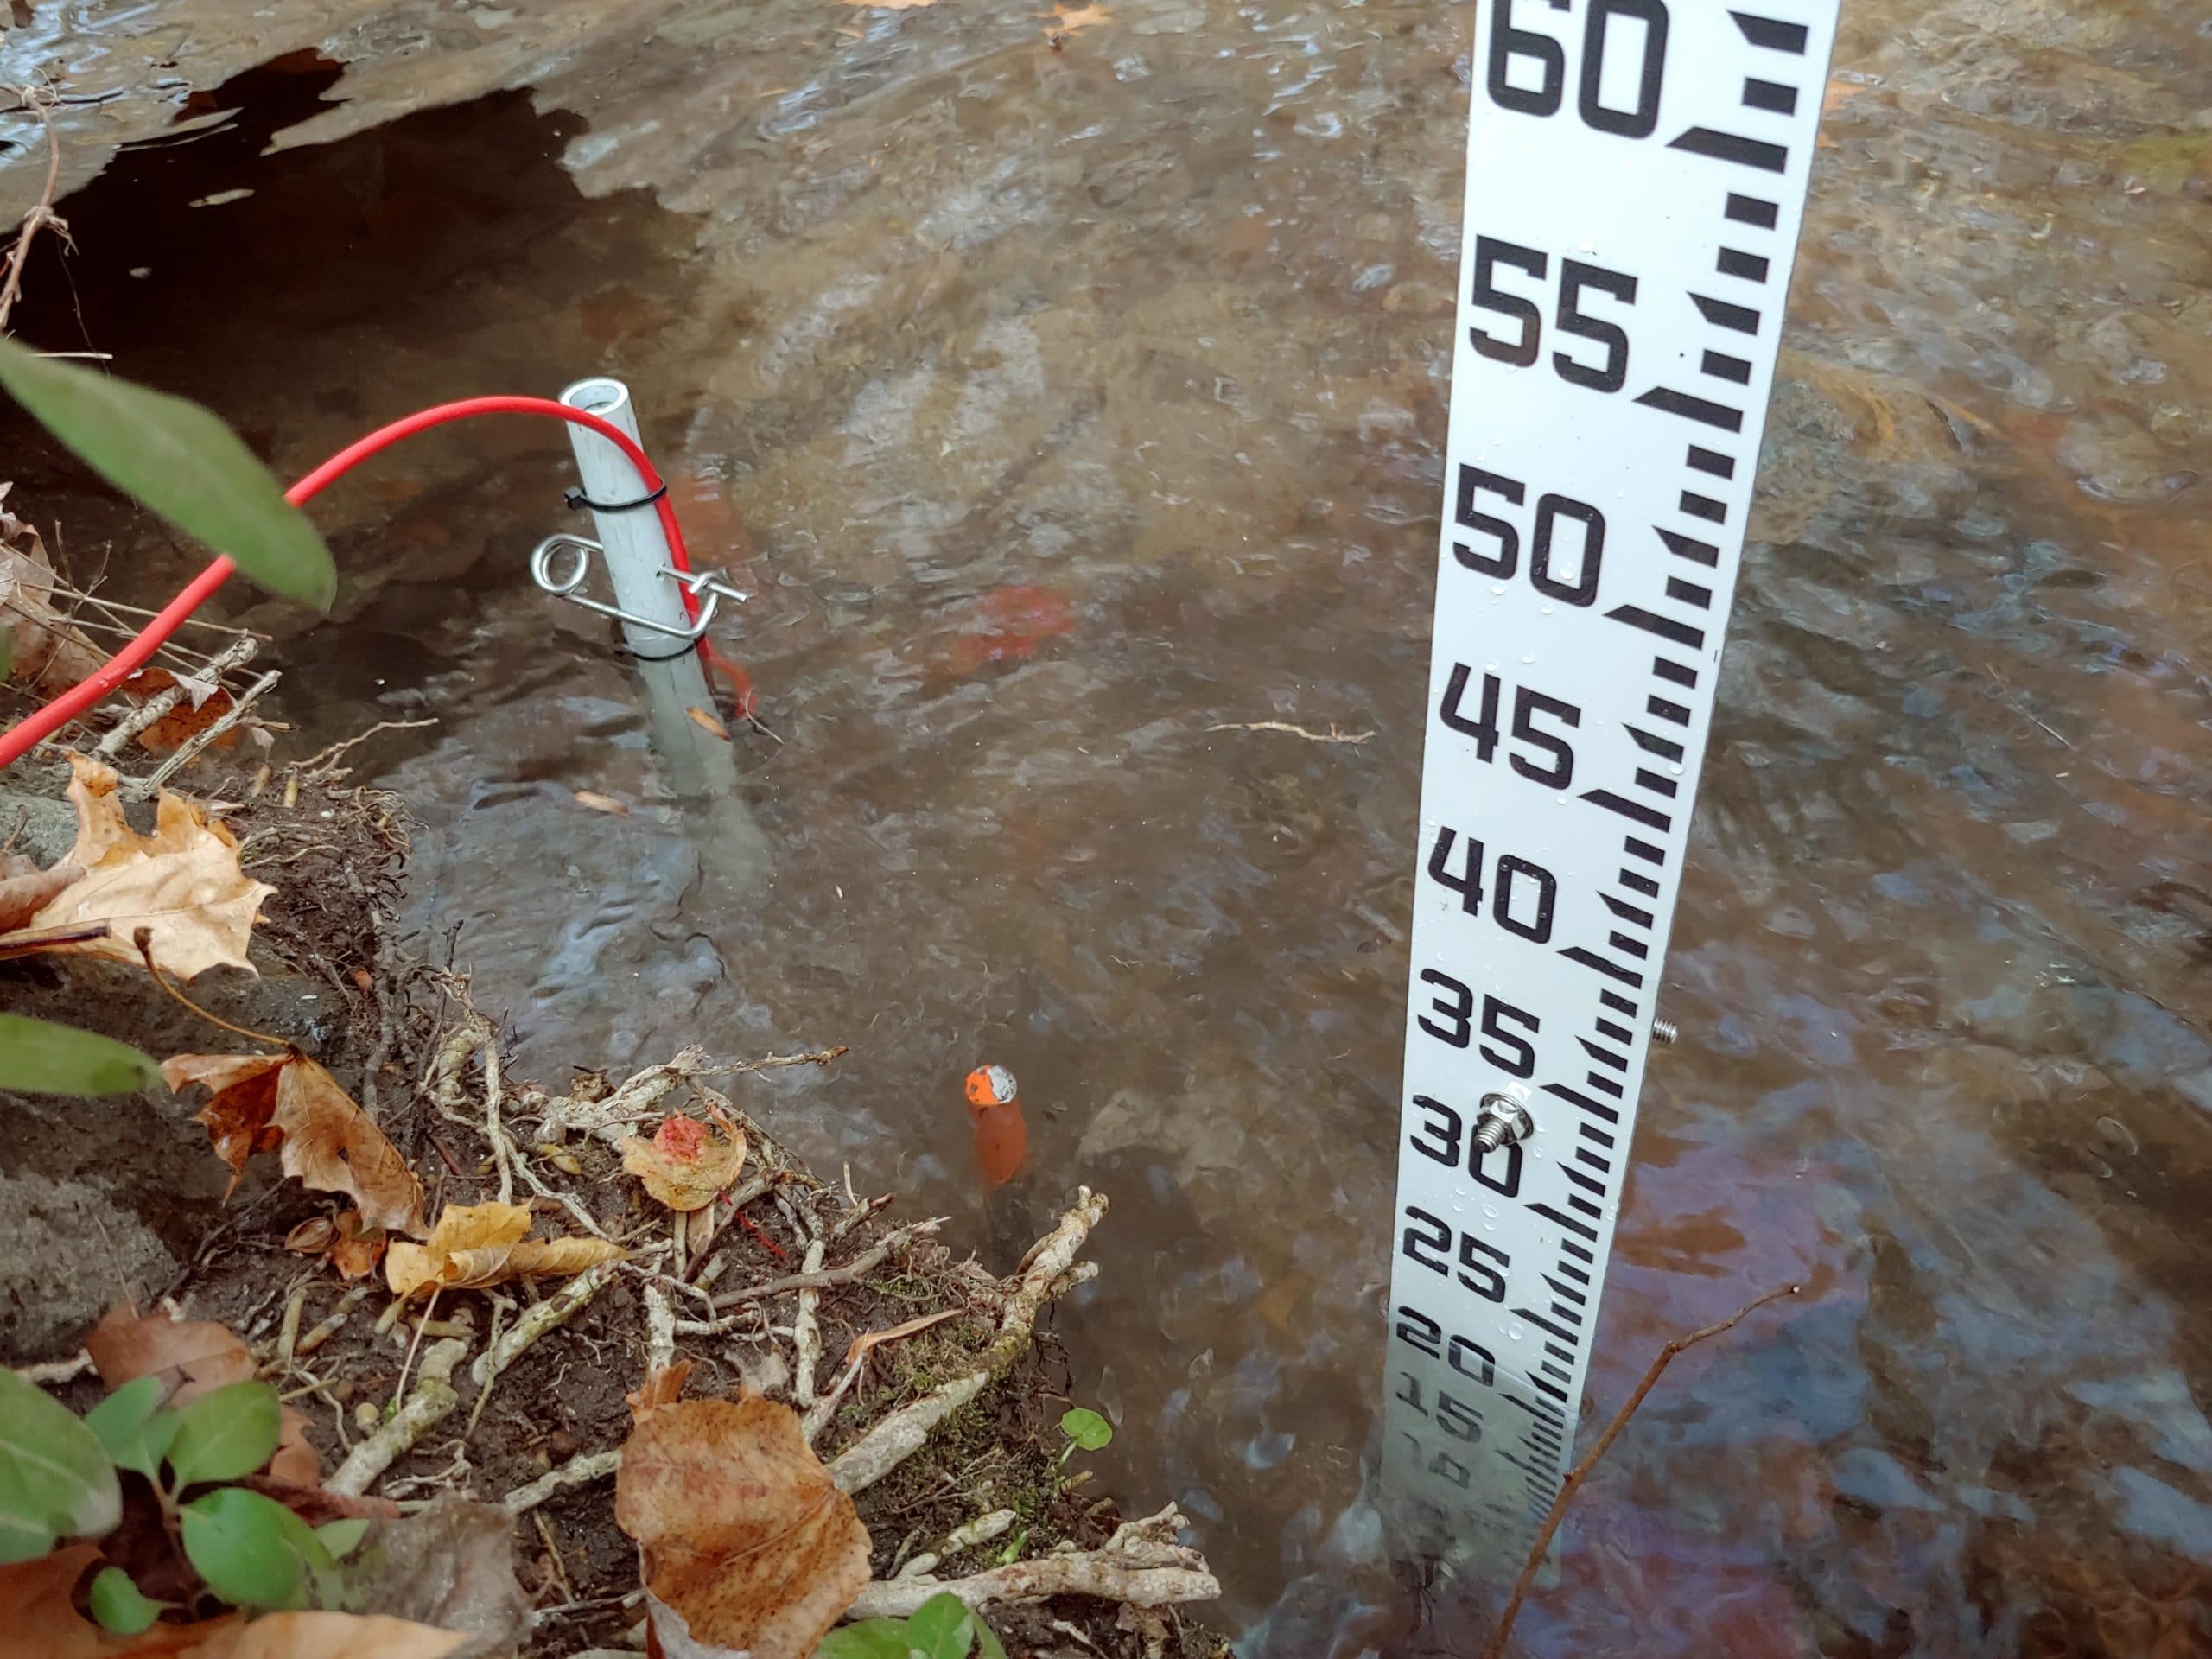
7.4.1 Additional Suggested On-Site Depth Reference: Rebar Depth QC Method
For sites where a staff gauge is continuously washing out, or changing orientation in any way, it may not be worthwhile to replace them. If this is the case, you can install an alternative method for QC depth, a method we are calling the rebar depth quality check. All you need for this is:
- Steel rebar pin ( or any type of rebar) – this is the 24in one, applicable in most situations. There is also an 18in and a 36in.
- orange spray paint
- a small (3-4lb) hammer
- a two by four if water is deep (so you don’t have to hammer too much underwater).
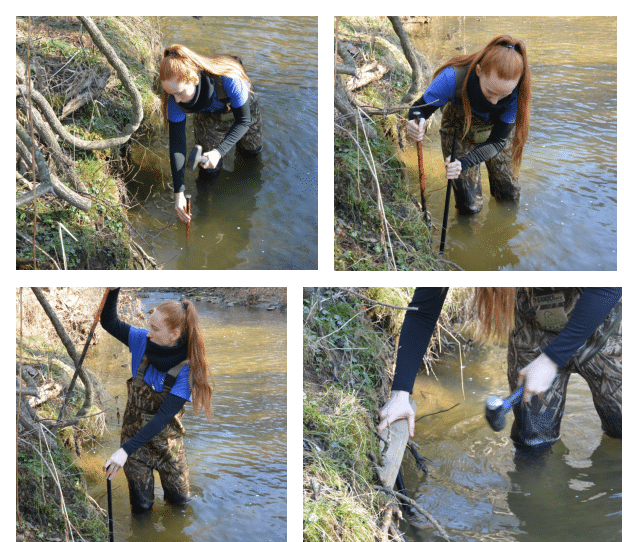
Measure distance from water surface to top of pin. This will be your reference. The difference between depth of pin and depth of CTD sensor should remain the same over time – this is your QC. The step-by-step process is:
- Paint the rebar pin in advance so it has time to dry
- At the site pound the pin into the stream bottom near the sensor – pound it in deep enough so that it’s underwater and is secure and stable in the stream bottom (do this when the stream is at base flow)
- Measure distance (in mm) from water surface to top of pin and record in general comments section of Field Visit Data sheet
- Record CTD depth at that time in general comments section of the field visit data sheet or field notebook
- Record offset calculation in general comments section: Distance from water surface to top of pin – CTDepth = Pin offset QC number
Regardless of water depth this “Rebar offset” should remain the same over time, if it doesn’t then that should be considered a red flag that something is wrong with CTDepth. This offset will also ensure that if the CTD sensor gets ripped out it can be re-installed at same depth.