
Home › Forums › Infrastructure and Equipment › Mobile Sensor Platform?
- This topic has 10 replies, 3 voices, and was last updated 2019-11-13 at 11:14 AM by
 Sara Damiano.
-
AuthorPosts
-
-
2019-11-05 at 3:16 PM #13304
Hi Guys, brand new here, so apologies for redundant questions etc.
I am in the process of building a mobile sensor platform, i.e. one that can be thrown into a daypack on a hike or floats behind a kayak. It has all the usual measurements (temp, turb, salinity etc) but I wonder if people have done this before in this community.
Specifically, I am interested if people have managed to upload their data from the device to “Monitor My Watershed” with varying GPS locations. As far as I can see, the locations are fixed for each “station”.
Thanks!
-
2019-11-05 at 5:04 PM #13305
@ensign has done some work with a moving/drifting sensor stations: https://www.fondriest.com/news/hydrosphere-drifter-brings-lagrangian-sampling-freshwater.htm
The way Monitor My Watershed’s data portal is set up right now is very “site-centric” – the web pages are just not set up to accept moving sensor data like you would generate. The database model which the website is built on can manage trajectory data, but the portal isn’t exposing that portion of the database. To put the data in right now you could pretend it’s all from a single station and then call latitude and longitude two of the your measured variables, but that’s definitely a cludgey way to do it.
For how the trajectory results can work in ODM2, see: https://github.com/ODM2/ODM2/blob/master/doc/ODM2Docs/ext_results_measurementframeworks.md and https://github.com/ODM2/ODM2/blob/master/doc/ODM2Docs/ext_results_trajectory.md
-
2019-11-05 at 7:10 PM #13306
Thanks @Sara,
I was aware of the floating sensors, I didn’t know they connected to a GIS and the company listed doesn’t seem to exist anymore. That was a very cool project though, do you have more information?The trajectory approach you explain above appears indeed a little “cludgey”, I appreciate your explanation but was wondering why this use case is so unusual, I had conversations with another GIS company about this who said the same thing. Site-centric is of course useful if the sensor remains immobile but many air quality sensors now are mounted on cars/busses/bikes and hence move. Am I the only one who would like that feature?
Thanks again, really appreciate what you guys do!
-
2019-11-08 at 3:01 PM #13307
Scott Ensign, formerly of Planktos Instruments, is now at Stroud. (He’s @ensign.)
I don’t know how “unusual” trajectory data is, but, at least in long term stream monitoring, it’s definitely far less common than fixed station monitoring. That type of data is also harder to manage, visualize, or conceptualize. I’d guess if others don’t support trajectory data it’s for those same reasons. Even including just site-specific data our feature wish list is far longer than we have the resources to ever complete.
What were you hoping to accomplish by uploading your data to MonitorMW? If your goal is to have your data easily sharable and searchable, I’d recommend using HydroShare (https://www.hydroshare.org/landingPage/). Hydroshare supports uploading ODM2 databases and netCDF multi-dimensional data. HydroShare is also a DOI provider for permanently tagging specific datasets. If you want to manage your own data, you might look into CZ Manager (https://github.com/ODM2/CZ-Manager), which is based on ODM2 (like MonitorMW) but gives much, much deeper database control. You could also look into the tools provided by groups like NCAR (https://ncar.ucar.edu/) – I don’t have any personal familiarity with any of them though. I don’t actually know of any spiffy online data viewers, to send you to, but I haven’t ever looked either.
I hope one of those is more helpful! I’m sorry MonitorMW isn’t ready for your data yet!
-
2019-11-08 at 3:30 PM #13308
Hi Oscamo. Indeed, I was formerly at Planktos Instruments but now at the Stroud Center. In responding to Sara’s comment about trajectory data being hard to visualize, check out this video showing dissolved oxygen data along 22 miles of the Neuse River in North Carolina.
We’ve been collecting trajectory data with drifter technology here at the Stroud Center; this post doesn’t show data but the video is fun.
Can you share more about the data you are trying to collect and what parameters?
-
2019-11-08 at 3:56 PM #13309
Thanks @ensign and @srgdamiano, for your reply. Scott, I saw a write up of your floating buoy some time ago and really wanted to find out what happened to it. That was cool stuff!
My project is a little lengthy to explain but I would love your input – I’ll call next week if that is ok with you. Can you pm me a good time/number to call?
Many thanks!
-
2019-11-08 at 5:37 PM #13313
@ensign – yup, it’s a nice video. But… creating a video like that automatically for every set of uploaded trajectory data is just a little bit more difficult than making a simple plot with time on the x axis.
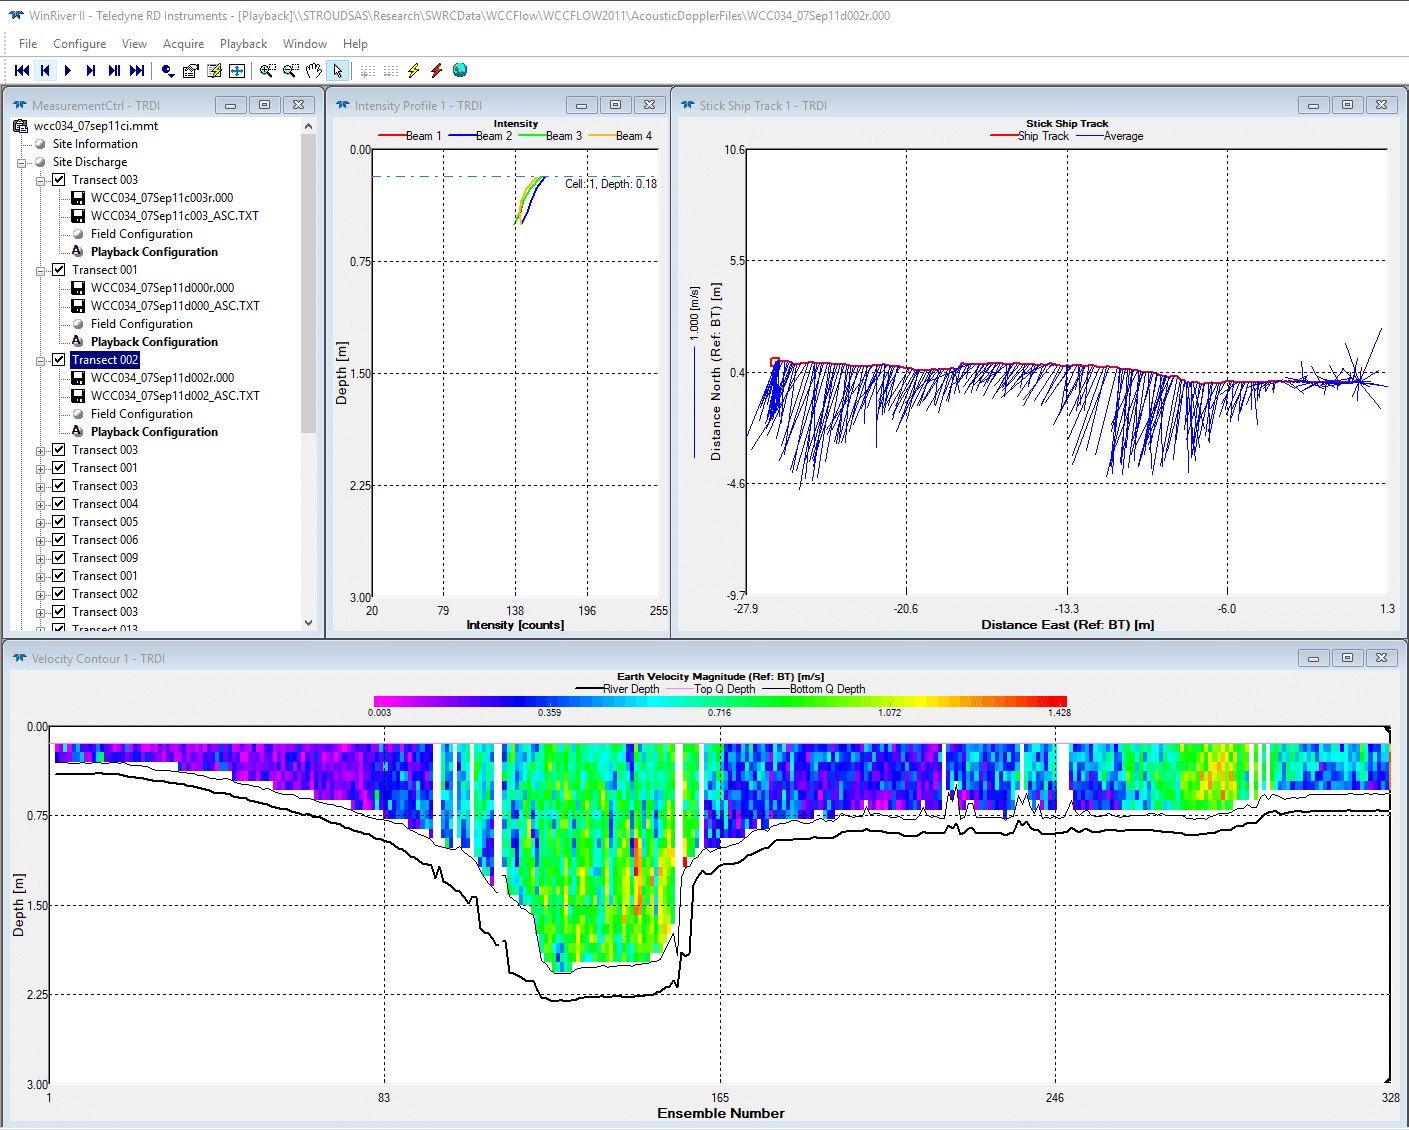
The WinRiverII software for the moving acoustic Doppler current profilers that we use to take discharge measurements has some nice visualizations for the boat tracks and the velocity profile. I think the “stick ship track” plot is a really nice way of cramming multi-dimensional data into a very simple single plot. But even though it’s “trajectory” data, the path of the ADCP is much simpler than what I’m guessing @osca is up to and MonitorMW still couldn’t handle it.
Attachments:
-
2019-11-10 at 11:12 AM #13318
Thanks @srgdamiano, this is a great way to display the data and I think my application is simpler than that. In principle, I want to create “spot” checks of sampled data similar to what has been done for decades with water quality monitors from YSI, Horiba, OTT etc but map them on a GIS system.
This means, the _device_ moves around (as it is owned by the technician) but the _data_ has a GPS tag that locks it into place. Compared to stationary sensors this complicates the analytics of course as Location 1 is not necessarily connected to Location 2 by the same waterway. When the technician returns to the same spot later, the GPS coordinates match but of course, now we have a different time-stamp: and thats where we have data continuity.I am probably overlooking something very basic but it seems to be a very straight-forward way of plotting
waterenvironmental quality data. -
2019-11-11 at 5:05 PM #13321
Hm. I’m not quite sure I follow you.
It sounds like you have a sensor package that you deploy at one spot for a while, then you stop it, pack it up, and move it somewhere else. After some time, you move the sensor package back to the original site. Is there ever data being collected while it’s moving, or is the GPS data only being collected to help the technician remember where they were on any given day? If the data is only being collected in discrete chunks while the sensors are stationary, you could create multiple stations for each stopping point and then manually chop your data up by location and upload the chunks. It’s kind-of a pain in the bottom, but if the stations are unrelated except for the equipment you’re using to make the measurements, I think that is the appropriate way to handle the data.
-
2019-11-11 at 6:09 PM #13323
Hm. Thanks @srgdamiano, thats one way of doing it. The use case I envisage is pretty simple. Lets take a single technician with a portable water quality monitor, like a YSI or something. He/She drops it into a river at Position A, records data. Then turns device off, moves to Position B, records data etc etc. Once “home” uploads the data to a GIS platform. Next week, repeat the process. Of course it could be a different technician with a different device but in the same location.
I spoke with @ensign today on the phone and will keep the conversation going, we are onto something!
-
2019-11-13 at 11:14 AM #13330
It sounds like what you’re really after is a good LIMS system to help your technicians ties measurements to the correct sites and then visualize them all together on a map. The MontitorMW portal can only really help with the visualization part.
-
-
AuthorPosts
- You must be logged in to reply to this topic.