
Home › Forums › Environmental Sensors › inconsistent Results
- This topic has 8 replies, 3 voices, and was last updated 2017-04-30 at 5:09 PM by
lilcano.
-
AuthorPosts
-
-
2017-04-23 at 2:21 PM #2164
Hello,
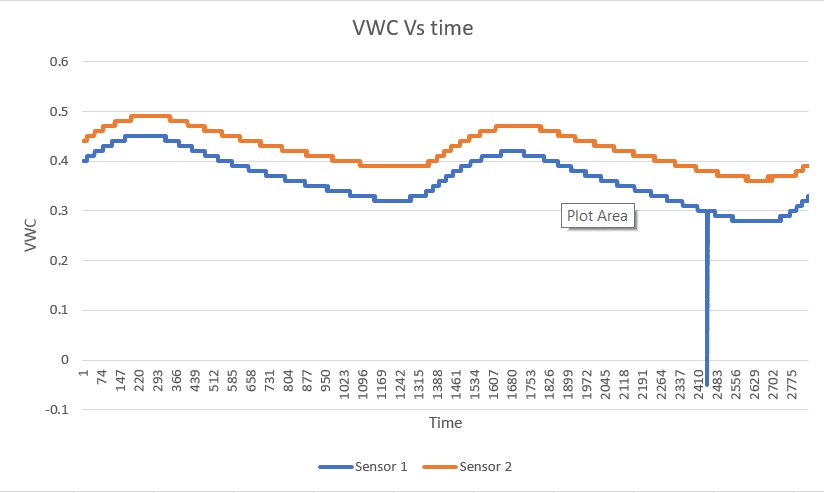
so i am using the SDI-12 library at https://github.com/EnviroDIY/Arduino-SDI-12.git to collect Ea and VWC data from the decagon 5TM sensors attached to an arduino Uno R3. Using the attached sketch, unfortunately the results obtained are inconsistent after several days of data collections. as shown in the plot of the different data points. has any one observed similar results? Or what am i doing wrong in the sketch? Please helpAttachments:
-
2017-04-24 at 11:45 AM #2169
It would be helpful for you to attach a jpg of png image of your graph instead of a Powerpoint slide. You also can’t attach the raw .ino file to forum posts, but you can cut and paste it using the “code” tags in the post editor tools.
And on your graph, can you please label both the x and y-axis? I don’t know what parameter you’re graphing and on what time scale your measurements covered. I’m assuming your graph shows either temperature or soil moisture. How were you testing the sensor? Was is installed outside or in a controlled environment? What kind of results were you expecting and what makes you think something is inconsistent?
-
2017-04-25 at 1:36 AM #2172
Hello,
Thanks for the quick response.Bellow is the sketch running on the arduino Uno R3. The devices where actually tested on the field(not in a controlled environment).The results shown on the plot is VMC collected every minute from the sensors. Actually the VWC is expected to reduce with time, these results are collected over a period of 3 days. Surprisingly they show a sinusoidal curve and the sensors are places in a sandy loam soil. I am thinking maybe the sketch has some problem. Please do you have any ideas why such results?1234567891011121314151617181920212223242526272829303132333435363738394041424344454647484950515253545556575859606162636465666768697071727374757677787980//This is the first code for taking data from the 5TM sensor and showing it on the Arduino serial mornitor#include <SDI12.h>#define DATAPIN 7 // change to the proper pin for sdi-12 data pin, I prefer D7SDI12 mySDI12(DATAPIN);unsigned long previousMillis = 0;const long interval = 60000; //set the interval (in milliseconds). ex: 60000 = 60 secondsvoid setup (){pinMode(13, OUTPUT);digitalWrite(13, LOW); //turn off the onboard LED to start withSerial.begin(57600);mySDI12.begin();Serial.println("Sketch for sampling multiple SDI12 sensors");delay(1000);}void loop (){unsigned long currentMillis = millis();if(currentMillis - previousMillis >= interval || previousMillis == 0) {previousMillis = currentMillis;digitalWrite(13, HIGH); //turn on the onboard LED to show that samples are being takenSerial.print("Time: ");Serial.print(currentMillis/1000); //print out the current time, in secondsSerial.print(" ---- ");for (char j = '1'; j <= '2'; j++) { //go through channels 1 to 6tmMeasurement(j);}Serial.println();digitalWrite(13, LOW); //turn off the LED to show that samples are done}delay(1000);}void tmMeasurement(char c){ //5TM soil moisture sensorString command = "";float Ea = 0.0;float temp = 0.0;float VWC = 0.0;command += c;command += "M!"; // SDI-12 measurement command format [address]['M'][!]mySDI12.sendCommand(command);delay(500); // wait a secmySDI12.flush();command = "";command += c;command += "D0!"; // SDI-12 command to get data [address][D][dataOption][!]mySDI12.sendCommand(command);delay(500);if(mySDI12.available() > 0){int channel = mySDI12.parseInt();Ea = mySDI12.parseFloat();temp = mySDI12.parseFloat();VWC = (4.3e-6*(Ea*Ea*Ea)) - (5.5e-4*(Ea*Ea)) + (2.92e-2 * Ea) - 5.3e-2 ; //the TOPP equation used to calculate VWCSerial.print("Sensor:");Serial.print(channel);Serial.print(": Ea=");Serial.print(Ea); //apparent dielectric permittivitySerial.print(", VWC=");Serial.print(VWC); //volumetric water contentSerial.print("%, Temp=");Serial.print(temp); //TempeeratureSerial.print("degC .... ");}mySDI12.flush();}Attachments:
-
2017-04-25 at 8:01 AM #2174
The graph looks more like a plot of temperature rather than VWC. Are you sure you’re plotting the right column of data? What are you using to actually record the data? Your sketch doesn’t output the data to a file or even print it in a easily-captured string out to the serial port, so I’m wondering how you collected multiple days of data. Plot your other variable and see what it looks like. The code also shows that you’re using 2 sensors. What does the data from the second sensor look like? The easiest way to see if a probe is working properly is to install 2 of them in the same location and in the same media and see if you get similar results for both of them.
-
2017-04-25 at 11:47 PM #2177
Hello,
I just checked again and yes i am plotting the VWC. As for the collection of the data i am actually using an SD card shield on the arduino to store the data. As you can see from the image there are two curves each one for the different sensors placed at the same location. After getting this results i decided to take out the SD card shield and run the attach sketch with the arduino connected to my computer and unfortunately i obtain similar results on the arduino IDE serial monitor. please any ideas?
-
2017-04-26 at 8:53 AM #2178
Please, like Shannon suggested, copy in your actual code using the “Add Code Snippet” button and actually attach your raw data, not a picture of it. Also, like Shannon said, please plot your EA and temperature to see how they look. And, again, like Shannon said, explain:
How were you testing the sensor? Was is installed outside or in a controlled environment? What kind of results were you expecting and what makes you think something is inconsistent?
-
2017-04-26 at 11:19 PM #2179
Hello Sara,
Thanks for the reply, attached is a copy of the actual raw data and the sensor and arduino are actually places in a field(so not a controlled environment). I was expecting the VWC to reduce with time and not the sinusoidal behavior, Equally the Ea will give similar curve because its used to calculate the VWC using the Topps equation. Please can you take a look at the attached raw data and advice?
Attachments:
-
2017-04-27 at 12:08 PM #2181
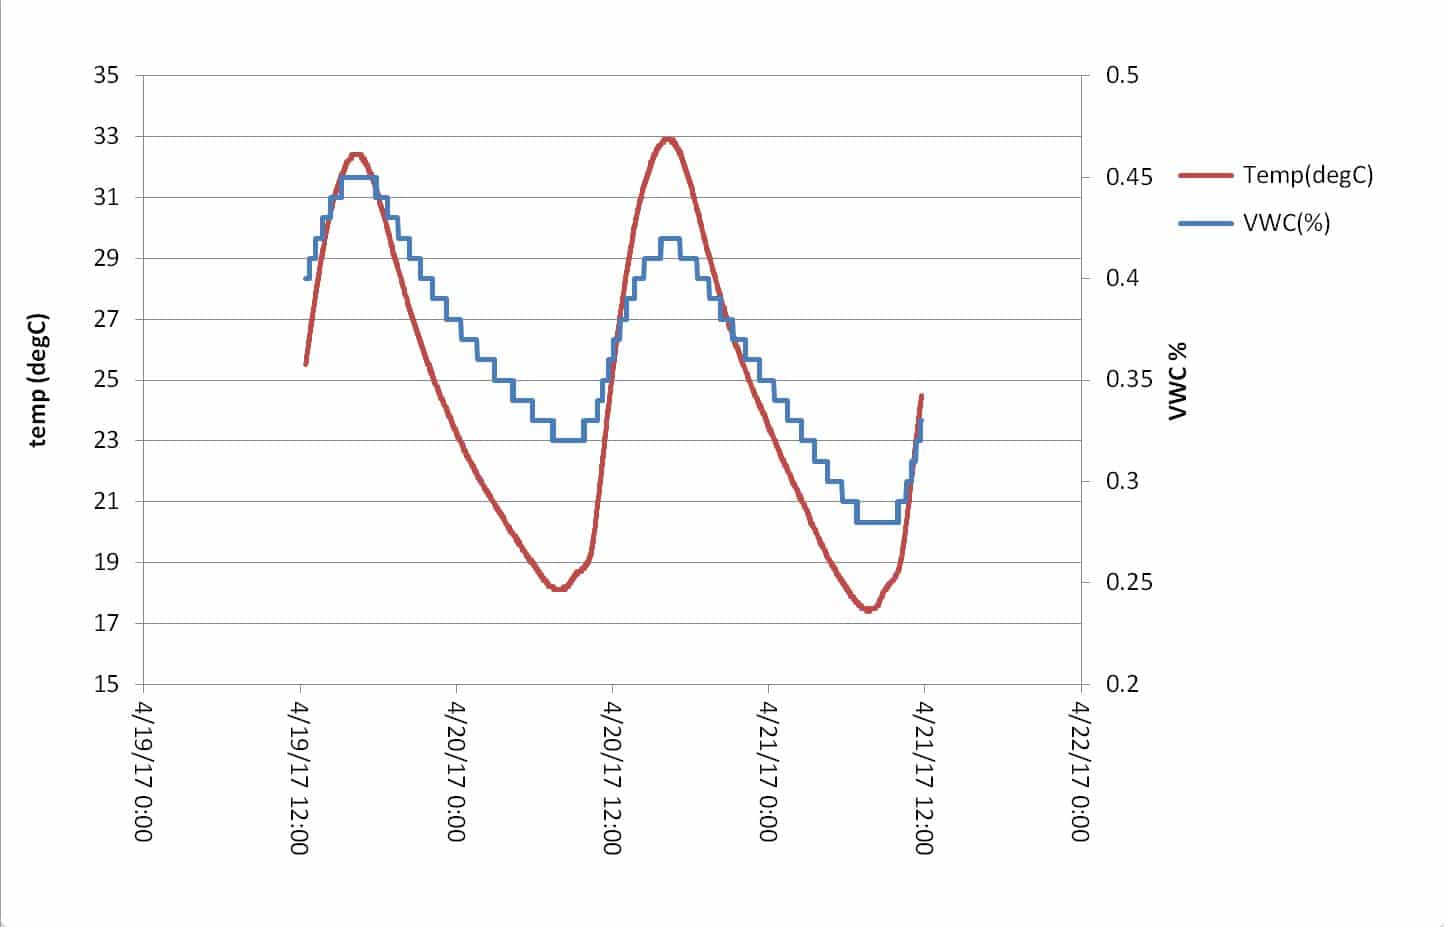
I plotted the temperature and VWC on the same chart and you can see that they are very much linked together. Can you answer whether the sensor is completely buried in the soil, and if so how deep is it? If only the fiberglass tines are inserted into the soil but the rest of the sensor body is above ground and subjected to direct sunlight or drastic temperature swings, then I would assume that’s what causing the issue.
Can you also post the actual sketch you used on your Arduino board to capture your data and write it to the memory card. I can also show you how to record more significant digits for the VWC parameter so that you get finer resolution and a smoother curve. But I need you to post the actual sketch you used for the logger. And tell us exactly how the sensor was installed in the ground. Can you repeat this experiment indoors where the temperature is constant and in a pot of soil or somewhere where you can purposely vary the moisture content?
Attachments:
-
2017-04-30 at 5:09 PM #2191
Hello Hicks,
Thanks for the reply, the sensors are buried completely in the soil as for the length i did not really measure that. Please see the attached file for the complete sketch running on the Arduino, and let me know what you think.
123456789101112131415161718192021222324252627282930313233343536373839404142434445464748495051525354555657585960616263646566676869707172737475767778798081828384858687888990919293949596979899100101102103104105106107108109110111112113114115116117118119120121122123124125126127128129130131132133134135136137138139140141142143144145146147148149150151152153154155156157158159160161162163164165166167168169170171172173174175176177178179180181182183184185186187188189190191192193194195196197198199200201202203204205206207208209210211212213214215216217218219220221222223224225226227228229230231232233234235236237238239240241242243244245246247248249250251252253254255256257258259/*This is the first code for taking data from the 5TM sensor and showing it on the Arduino serial mornitor//The data is collected from the SDI12 sensor and timestamped then stored onto an SD card */#include <SDI12.h>#include <SPI.h>#include <SD.h>#include <Wire.h>#include "RTClib.h"#define ECHO_TO_SERIAL 1 // echo data to serial port#define WAIT_TO_START 0 // Wait for serial input in setup()#define SYNC_INTERVAL 60000 // mills between calls to flush() - to write data to the carduint32_t syncTime = 0; // time of last sync()#define DATAPIN 5 // change to the proper pin for sdi-12 data pin, I prefer D7SDI12 mySDI12(DATAPIN);//Define the number of sensors connectedRTC_PCF8523 RTC; // define the Real Time Clock object//the digitalpins that connect to the LEDS#define redLEDpin 2#define greenLEDpin 3unsigned long previousMillis = 0;const long interval = 60000; //set the interval (in milliseconds). ex: 60000 = 60 seconds// for the data logging shield, we use digital pin 10 for the SD cs lineconst int chipSelect = 10;// the logging fileFile logfile;//Function for handling errors that occurvoid error(char *str){Serial.print("error: ");Serial.println(str);// red LED indicates errordigitalWrite(redLEDpin, HIGH);while(1);}//Function for the working with the real time clock//and time stamping the data collected from the sensorsvoid timestamp(){// fetch the timeDateTime now = RTC.now();// log time//logfile.print(now.unixtime()); // seconds since 1/1/1970logfile.print(", ");logfile.print('"');logfile.print(now.year(), DEC);logfile.print("/");logfile.print(now.month(), DEC);logfile.print("/");logfile.print(now.day(), DEC);logfile.print(" ");logfile.print(now.hour(), DEC);logfile.print(":");logfile.print(now.minute(), DEC);logfile.print(":");logfile.print(now.second(), DEC);logfile.print('"');#if ECHO_TO_SERIAL//Serial.print(now.unixtime()); // seconds since 1/1/1970Serial.print(", ");Serial.print('"');Serial.print(now.year(), DEC);Serial.print("/");Serial.print(now.month(), DEC);Serial.print("/");Serial.print(now.day(), DEC);Serial.print(" ");Serial.print(now.hour(), DEC);Serial.print(":");Serial.print(now.minute(), DEC);Serial.print(":");Serial.print(now.second(), DEC);Serial.print('"');#endif //ECHO_TO_SERIAL}//Function that runs at the start of the program oncevoid setup (){//Debugging ledsSerial.begin(57600);mySDI12.begin();pinMode(greenLEDpin, OUTPUT);pinMode(redLEDpin, OUTPUT);#if WAIT_TO_STARTSerial.println("Type any character to start");while (!Serial.available());#endif //WAIT_TO_START// initialize the SD cardSerial.print("Initializing SD card...");// make sure that the default chip select pin is set to// output, even if you don't use it:pinMode(10, OUTPUT);// see if the card is present and can be initialized:if (!SD.begin(chipSelect)) {error("Card failed, or not present");}Serial.println("card initialized.");// create a new filechar filename[] = "LOGGER00.CSV";for (uint8_t i = 0; i < 100; i++) {filename[6] = i/10 + '0';filename[7] = i%10 + '0';if (! SD.exists(filename)) {// only open a new file if it doesn't existlogfile = SD.open(filename, FILE_WRITE);break; // leave the loop!}}if (! logfile) {error("couldnt create file");}Serial.print("Logging to: ");Serial.println(filename);// connect to RTCWire.begin();if (!RTC.begin()) {logfile.println("RTC failed");#if ECHO_TO_SERIALSerial.println("RTC failed");#endif //ECHO_TO_SERIAL}digitalWrite(greenLEDpin, LOW); //turn off the onboard LED to start withlogfile.println("Sketch for sampling multiple SDI12 sensors");logfile.print(", ,");for(int i=0; i<=2; i++){logfile.print(" Sensor_Num, Ea, VWC(%), Temp(degC) ");logfile.print(",");}logfile.println();#if ECHO_TO_SERIALSerial.println("Sketch for sampling multiple SDI12 sensors");for(int i=0; i<=2; i++){Serial.print(" Sensor_Num, Ea, VWC(%), Temp(degC) ");}#endif//ECHO_TO_SERIALSerial.println();delay(1000);}void loop (){//unsigned long currentMillis = millis();uint32_t currentMillis = millis();if(currentMillis - previousMillis >= interval || previousMillis == 0) {previousMillis = currentMillis;digitalWrite(greenLEDpin, HIGH); //turn on the onboard LED to show that samples are being takenSerial.print("Time: ");Serial.print(currentMillis/1000); //print out the current time, in secondslogfile.print(currentMillis/1000);Serial.print("-----");timestamp();for (char j = '1'; j <= '3'; j++) { //go through channels 1 to 6tmMeasurement(j);}logfile.println();Serial.println();digitalWrite(greenLEDpin, LOW); //turn off the LED to show that samples are done// Now we write data to disk! Don't sync too often - requires 2048 bytes of I/O to SD card// which uses a bunch of power and takes timeif ((millis() - syncTime) < SYNC_INTERVAL) return;syncTime = millis();// blink LED to show we are syncing data to the card & updating FAT!digitalWrite(redLEDpin, HIGH);logfile.flush();digitalWrite(redLEDpin, LOW);}delay(1000);}void tmMeasurement(char c){ //5TM soil moisture sensorString command = "";float Ea = 0.0;float temp = 0.0;float VWC = 0.0;command += c;command += "M!"; // SDI-12 measurement command format [address]['M'][!]mySDI12.sendCommand(command);delay(500); // wait a secmySDI12.flush();command = "";command += c;command += "D0!"; // SDI-12 command to get data [address][D][dataOption][!]mySDI12.sendCommand(command);delay(500);if(mySDI12.available() > 0){int channel = mySDI12.parseInt();Ea = mySDI12.parseFloat();temp = mySDI12.parseFloat();VWC = (4.3e-6*(Ea*Ea*Ea)) - (5.5e-4*(Ea*Ea)) + (2.92e-2 * Ea) - 5.3e-2 ; //the TOPP equation used to calculate VWC//Serial.print("Sensor:");//logfile.print(",");logfile.print(",");logfile.print(channel);logfile.print(",");//Serial.print(": Ea=");logfile.print(Ea); //apparent dielectric permittivitylogfile.print(",");//Serial.print(", VWC=");logfile.print(VWC); //volumetric water contentlogfile.print(",");//Serial.print("%, Temp=");logfile.print(temp); //Tempeerature//logfile.print("degC .... ");#if ECHO_TO_SERIAL//Serial.print("Sensor:");Serial.print(",");Serial.print(channel);Serial.print(",");//Serial.print(": Ea=");Serial.print(Ea); //apparent dielectric permittivitySerial.print(",");//Serial.print(", VWC=");Serial.print(VWC); //volumetric water contentSerial.print(",");//Serial.print("%, Temp=");Serial.print(temp); //TempeeratureSerial.print(".... ");#endif}mySDI12.flush();}Thanks
-
-
AuthorPosts
- You must be logged in to reply to this topic.