Welcome to EnviroDIY, a community for do-it-yourself environmental science and monitoring. EnviroDIY is part of WikiWatershed, an initiative of Stroud Water Research Center designed to help people advance knowledge and stewardship of fresh water. New to EnviroDIY?Start here
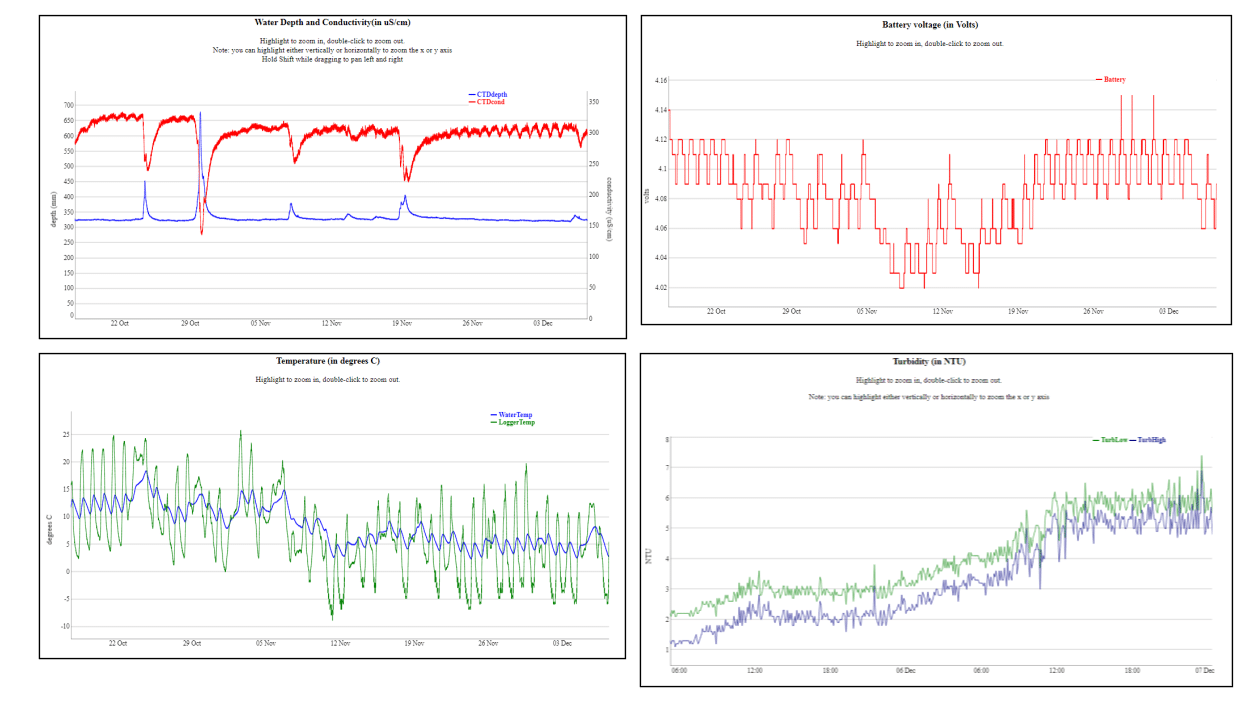
Figure B.1. Example plots of CTD and turbidity sensor data. Logger temperature is measured by the Mayfly logger board and represents temperature inside the logger box. Battery level is also measured by the Mayfly logger board – target level is 3.7v to 4.2v. With OBS3 turbidity sensors, TurbLow is finer scale and has a maximum level of 250 NTU; TurbHigh is coarser with a max of 1000 NTU. Data from Hosensack Creek, near East Greenville, Pennsylvania.